
Page 372 - Sami Franssila Introduction to Microfabrication
P. 372
Yield 351
A more general model takes defect clustering into 100%
account and models the yield as 1
Y = D ×A ∝
Y random = (1 + (AD o /α)) −α (36.4) 1 + ∝
where α = cluster factor (Figure 36.3). ∝ = 1/2
Cluster factor α presents the tendency of defects to
cluster; that is, they are not randomly distributed but tend
to concentrate. The values of α are usually considered 10% ∝ = 1
trade secrets, and companies are very reluctant to
reveal their yield statistics. Cluster factor α = ∞ Chip yield Y
corresponds to Poisson distribution, and α = 1 results
in Seeds model: ∝ = 2
Y = (1 + AD) −1 (36.5)
Another yield model is known as Murphy’s 1%
∝ = ∞ ∝ = 4
Y = ((1 − exp(−DA))/DA) 2 (36.6) e −D ×A
Poisson
Chip size A is a result of two opposing trends: as yield
linewidths are scaled down, chip area should decrease; 0 2 4 6 8 10 12
but because more logic functions and more memory
capacity is added, the number of transistors on a Defects (D × A) in chip area
chip increases so fast that the chip area, in fact, Figure 36.3 Yield models compared: cluster factor α
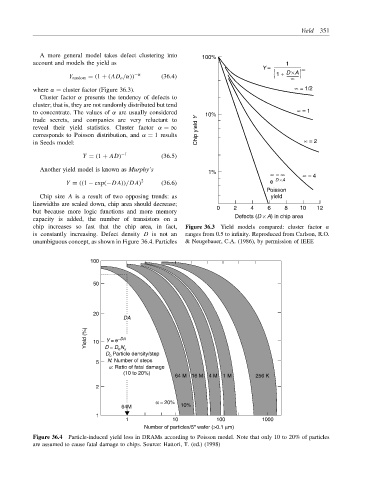
is constantly increasing. Defect density D is not an ranges from 0.5 to infinity. Reproduced from Carlson, R.O.
unambiguous concept, as shown in Figure 36.4. Particles & Neugebauer, C.A. (1986), by permission of IEEE
100
50
20
DA
Yield (%) 10 Y = e −DA
D = D o N a
D o Particle density/step
5 N: Number of steps
a: Ratio of fatal damage
(10 to 20%)
64 M 16 M 4 M 1 M 256 K
2
α = 20%
64M 10%
1
1 10 100 1000
Number of particles/5" wafer (>0.1 µm)
Figure 36.4 Particle-induced yield loss in DRAMs according to Poisson model. Note that only 10 to 20% of particles
are assumed to cause fatal damage to chips. Source: Hattori, T. (ed.) (1998)