
Page 63 - Lindens Handbook of Batteries
P. 63
2.20 PRINCIPLES OF OPERATION
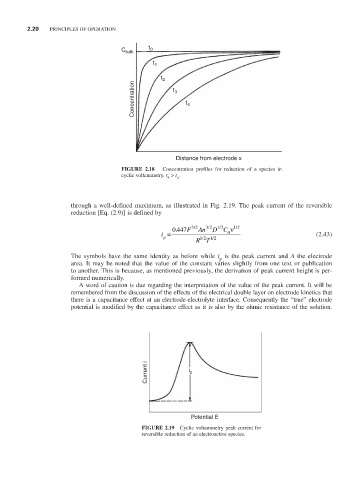
C bulk t 0
t 1
t 2
Concentration t 3 t 4
Distance from electrode x
FIGURE 2.18 Concentration profiles for reduction of a species in
cyclic voltammetry, t > t . o
4
through a well-defined maximum, as illustrated in Fig. 2.19. The peak current of the reversible
reduction [Eq. (2.9)] is defined by
/
/
/
/
12
0 447 F 32 An 32 D C ν 12
.
i = 0 (2.43)
p
12 12
/
RT /
The symbols have the same identity as before while i is the peak current and A the electrode
p
area. It may be noted that the value of the constant varies slightly from one text or publication
to another. This is because, as mentioned previously, the derivation of peak current height is per-
formed numerically.
A word of caution is due regarding the interpretation of the value of the peak current. It will be
remembered from the discussion of the effects of the electrical double layer on electrode kinetics that
there is a capacitance effect at an electrode-electrolyte interface. Consequently the “true” electrode
potential is modified by the capacitance effect as it is also by the ohmic resistance of the solution.
Current i i p
Potential E
FIGURE 2.19 Cyclic voltammetry peak current for
reversible reduction of an electroactive species.