
Page 68 - Lindens Handbook of Batteries
P. 68
ELECTROCHEMICAL PRINCIPLES AND REACTIONS 2.25
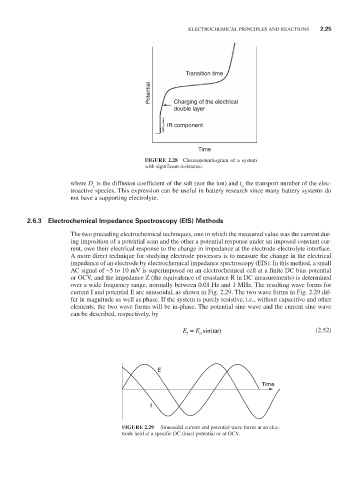
Transition time
Potential Charging of the electrical
double layer
IR component
Time
FIGURE 2.28 Chronopotentiogram of a system
with significant resistance.
where D is the diffusion coefficient of the salt (not the ion) and t the transport number of the elec-
s
o
troactive species. This expression can be useful in battery research since many battery systems do
not have a supporting electrolyte.
2.6.3 Electrochemical Impedance Spectroscopy (EIS) Methods
The two preceding electrochemical techniques, one in which the measured value was the current dur-
ing imposition of a potential scan and the other a potential response under an imposed constant cur-
rent, owe their electrical response to the change in impedance at the electrode-electrolyte interface.
A more direct technique for studying electrode processes is to measure the change in the electrical
impedance of an electrode by electrochemical impedance spectroscopy (EIS). In this method, a small
AC signal of ~5 to 10 mV is superimposed on an electrochemical cell at a finite DC bias potential
or OCV, and the impedance Z (the equivalence of resistance R in DC measurements) is determined
over a wide frequency range, normally between 0.01 Hz and 1 MHz. The resulting wave forms for
current I and potential E are sinusoidal, as shown in Fig. 2.29. The two wave forms in Fig. 2.29 dif-
fer in magnitude as well as phase. If the system is purely resistive, i.e., without capacitive and other
elements, the two wave forms will be in-phase. The potential sine wave and the current sine wave
can be described, respectively, by
E = E sin(ω (2.52)
t)
o
t
E
Time
I
FIGURE 2.29 Sinusoidal current and potential wave forms at an elec-
trode held at a specific DC (bias) potential or at OCV.