
Page 71 - Lindens Handbook of Batteries
P. 71
2.28 PRINCIPLES OF OPERATION
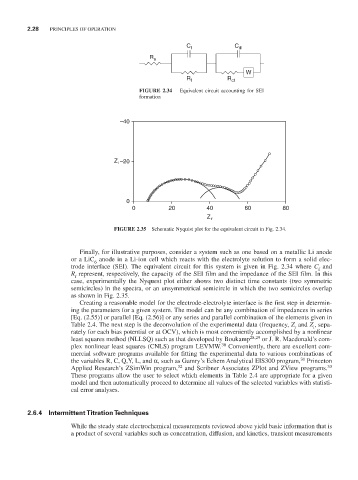
C f C dl
R e
W
R f R ct
FIGURE 2.34 Equivalent circuit accounting for SEI
formation
–40
Z i –20
0
0 20 40 60 80
Z r
FIGURE 2.35 Schematic Nyquist plot for the equivalent circuit in Fig. 2.34.
Finally, for illustrative purposes, consider a system such as one based on a metallic Li anode
or a LiC anode in a Li-ion cell which reacts with the electrolyte solution to form a solid elec-
6
trode interface (SEI). The equivalent circuit for this system is given in Fig. 2.34 where C and
f
R represent, respectively, the capacity of the SEI film and the impedance of the SEI film. In this
f
case, experimentally the Nyquest plot either shows two distinct time constants (two symmetric
semicircles) in the spectra, or an unsymmetrical semicircle in which the two semicircles overlap
as shown in Fig. 2.35.
Creating a reasonable model for the electrode-electrolyte interface is the first step in determin-
ing the parameters for a given system. The model can be any combination of impedances in series
[Eq. (2.55)] or parallel [Eq. (2.56)] or any series and parallel combination of the elements given in
Table 2.4. The next step is the deconvolution of the experimental data (frequency, Z and Z , sepa-
r
i
rately for each bias potential or at OCV), which is most conveniently accomplished by a nonlinear
least squares method (NLLSQ) such as that developed by Boukamp 28,29 or J. R. Macdonald’s com-
30
plex nonlinear least squares (CNLS) program LEVMW. Conveniently, there are excellent com-
mercial software programs available for fitting the experimental data to various combinations of
the variables R, C, Q,Y, L, and α, such as Gamry’s Echem Analytical EIS300 program, Princeton
31
Applied Research’s ZSimWin program, and Scribner Associates ZPlot and ZView programs.
32
33
These programs allow the user to select which elements in Table 2.4 are appropriate for a given
model and then automatically proceed to determine all values of the selected variables with statisti-
cal error analyses.
2.6.4 Intermittent Titration Techniques
While the steady state electrochemical measurements reviewed above yield basic information that is
a product of several variables such as concentration, diffusion, and kinetics, transient measurements