
Page 66 - Lindens Handbook of Batteries
P. 66
ELECTROCHEMICAL PRINCIPLES AND REACTIONS 2.23
2.6.2 Chronopotentiometry
Chronopotentiometry involves the study of voltage transients at an electrode upon which is imposed
a constant current. It is sometimes alternately known as galvanostatic voltammetry. In this tech-
nique, a constant current is applied to an electrode, and its voltage response indicates the changes in
electrode processes occurring at its interface. Consider, for example, the reduction of a species O as
expressed by Eq. (2.9). As the constant current is passed through the system, the concentration of O
in the vicinity of the electrode surface begins to decrease. As a result of this depletion, O diffuses
from the bulk solution into the depleted layer, and a concentration gradient grows out from the elec-
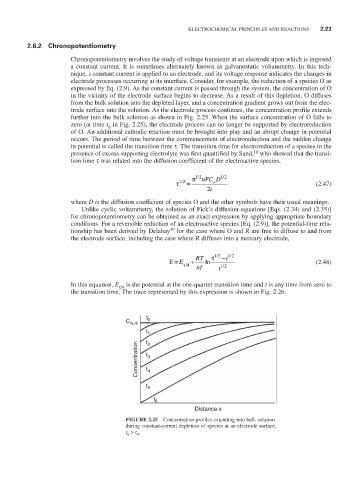
trode surface into the solution. As the electrode process continues, the concentration profile extends
further into the bulk solution as shown in Fig. 2.25. When the surface concentration of O falls to
zero (at time t in Fig. 2.25), the electrode process can no longer be supported by electroreduction
6
of O. An additional cathodic reaction must be brought into play and an abrupt change in potential
occurs. The period of time between the commencement of electroreduction and the sudden change
in potential is called the transition time τ. The transition time for electroreduction of a species in the
18
presence of excess supporting electrolyte was first quantified by Sand, who showed that the transi-
tion time τ was related into the diffusion coefficient of the electroactive species,
12
/
/
π nFCD 12
/
τ 12 = o (2.47)
2i
where D is the diffusion coefficient of species O and the other symbols have their usual meanings.
Unlike cyclic voltammetry, the solution of Fick’s diffusion equations [Eqs. (2.34) and (2.35)]
for chronopotentiometry can be obtained as an exact expression by applying appropriate boundary
conditions. For a reversible reduction of an electroactive species [Eq. (2.9)], the potential-time rela-
tionship has been derived by Delahay for the case where O and R are free to diffuse to and from
19
the electrode surface, including the case where R diffuses into a mercury electrode,
=
EE + RT ln τ / 12 t - / 12 (2.48)
τ/4 nf t / 12
In this equation, E is the potential at the one-quarter transition time and t is any time from zero to
τ/4
the transition time. The trace represented by this expression is shown in Fig. 2.26.
t
C bulk 0
t 1 2
t
Concentration t t 3 4
t 5
t 6
Distance x
FIGURE 2.25 Concentration profiles extending into bulk solution
during constant-current depletion of species at an electrode surface,
t > t .
0
6