Page 67 - Lindens Handbook of Batteries
P. 67

2.24        PRINCIPLES OF OPERATION


                               Potential                                Potential  E τ/4


                                                                                              Transition
                                                                                                time τ


                                     τ/4     Time        τ                          Time
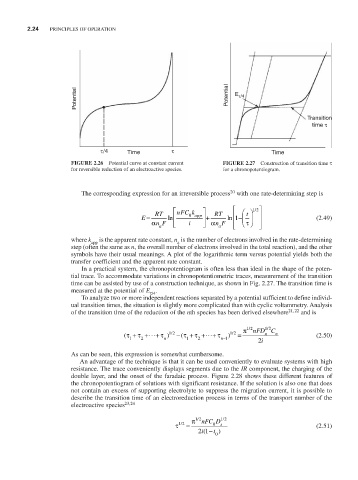
                             FIGURE 2.26  Potential curve at constant current  FIGURE 2.27  Construction of transition time τ
                             for reversible reduction of an electroactive species.  for a chronopotentiogram.


                                                                         20
                                The corresponding expression for an irreversible process  with one rate-determining step is
                                                          nFCk              1//2
                                                                              t
                                                                          
                                                 E =  RT  ln   0  app  +  RT  ln 1 -            (2.49)
                                                   α  nF     i   α    nF       τ   
                                                                      a
                                                      a
                             where k app  is the apparent rate constant, n  is the number of electrons involved in the rate-determining
                                                           a
                             step (often the same as n, the overall number of electrons involved in the total reaction), and the other
                             symbols have their usual meanings. A plot of the logarithmic term versus potential yields both the
                             transfer coefficient and the apparent rate constant.
                                In a practical system, the chronopotentiogram is often less than ideal in the shape of the poten-
                             tial trace. To accommodate variations in chronopotentiometric traces, measurement of the transition
                             time can be assisted by use of a construction technique, as shown in Fig. 2.27. The transition time is
                             measured at the potential of E .
                                                   τ/4
                                To analyze two or more independent reactions separated by a potential sufficient to define individ-
                             ual transition times, the situation is slightly more complicated than with cyclic voltammetry. Analysis
                             of the transition time of the reduction of the nth species has been derived elsewhere 21, 22  and is
                                                                                   1//2
                                                                              / 12
                                                                                   n
                                            ( τ  τ +  ⋅⋅⋅+ τ +  )  / 12  ( τ  +  τ -  τ +⋅⋅⋅+  )  / 12  =  π nFD C n      (2.50)
                                             1  2      n     1  2     n  1 -     2i
                             As can be seen, this expression is somewhat cumbersome.
                                An advantage of the technique is that it can be used conveniently to evaluate systems with high
                             resistance. The trace conveniently displays segments due to the IR component, the charging of the
                             double layer, and the onset of the faradaic process. Figure 2.28 shows these different features of
                             the chronopotentiogram of solutions with significant resistance. If the solution is also one that does
                             not contain an excess of supporting electrolyte to suppress the migration current, it is possible to
                             describe the transition time of an electroreduction process in terms of the transport number of the
                             electroactive species 23,24
                                                                       /
                                                               12
                                                                /
                                                           /
                                                                    0
                                                                      s
                                                          τ 12  =  π nFCD 12                     (2.51)
                                                                 i
                                                                21- t  )
                                                                  (
                                                                     0
   62   63   64   65   66   67   68   69   70   71   72