
Page 226 - Low Temperature Energy Systems with Applications of Renewable Energy
P. 226
Heating with geothermal systems 213
Table 5.6 Thermodynamic state-point properties for the 2-stage HPU in Fig. 5.32.
v, h, s, e,
3
Cycle points P, kPa T, 8S m /kg kJ/kg kJ/kg$8S kJ/kg
Working fluid [ R407c
1 1025.0 25 0.0221 414.30 1.7284 62.02
2 2441.9 72.4 0.0099 446.92 1.7669 83.16
3 2441.9 54.1 0.0010 284.44 1.2755 67.19
4 1025.0 21.1 0.0072 284.44 1.2900 62.86
Working fluid [ R134a
5 1311.1 67.4 0.0171 443.96 1.7695 58.53
6 2670.2 104.2 0.0084 465.34 1.7845 75.44
7 2670.2 80 0.0011 322.28 1.3832 52.02
8 1311.1 49.8 0.0057 322.28 1.3943 48.71
Note: Dead state is taken at T 0 ¼ 25 C and P 0 ¼ 0.1013 MPa.
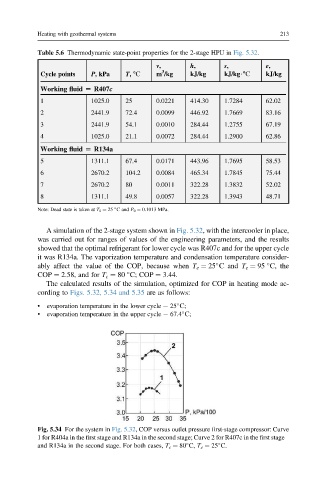
A simulation of the 2-stage system shown in Fig. 5.32, with the intercooler in place,
was carried out for ranges of values of the engineering parameters, and the results
showed that the optimal refrigerant for lower cycle was R407c and for the upper cycle
it was R134a. The vaporization temperature and condensation temperature consider-
ably affect the value of the COP, because when T e ¼ 25 S and T c ¼ 95 C, the
COP ¼ 2.58, and for T c ¼ 80 C; COP ¼ 3.44.
The calculated results of the simulation, optimized for COP in heating mode ac-
cording to Figs. 5.32, 5.34 and 5.35 are as follows:
• evaporation temperature in the lower cycle e 25 S;
• evaporation temperature in the upper cycle e 67.4 S;
Fig. 5.34 For the system in Fig. 5.32, COP versus outlet pressure first-stage compressor: Curve
1 for R404a in the first stage and R134a in the second stage; Curve 2 for R407c in the first stage
and R134a in the second stage. For both cases, T c ¼ 80 C, T e ¼ 25 C.