
Page 52 - MATLAB an introduction with applications
P. 52
MATLAB Basics ——— 37
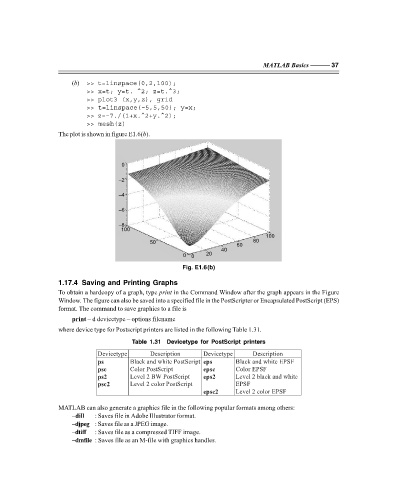
(b) >> t=linspace(0,2,100);
>> x=t; y=t. ^2; z=t.^3;
>> plot3 (x,y,z), grid
>> t=linspace(–5,5,50); y=x;
>> z=–7./(1+x.^2+y.^2);
>> mesh(z)
The plot is shown in figure E1.6(b).
0
–2
–4
–6
–8
100
100
50 80
60
40
0 0 20
Fig. E1.6(b)
1.17.4 Saving and Printing Graphs
To obtain a hardcopy of a graph, type print in the Command Window after the graph appears in the Figure
Window. The figure can also be saved into a specified file in the PostScripter or Encapsulated PostScript (EPS)
format. The command to save graphics to a file is
print – d devicetype – options filename
where device type for Postscript printers are listed in the following Table 1.31.
Table 1.31 Devicetype for PostScript printers
Devicetype Description Devicetype Description
ps Black and white PostScript eps Black and white EPSF
psc Color PostScript epsc Color EPSF
ps2 Level 2 BW PostScript eps2 Level 2 black and white
psc2 Level 2 color PostScript EPSF
epsc2 Level 2 color EPSF
MATLAB can also generate a graphics file in the following popular formats among others:
–dill : Saves file in Adobe Illustrator format.
–djpeg : Saves file as a JPEG image.
–dtiff : Saves file as a compressed TIFF image.
–dmfile : Saves file as an M-file with graphics handles.
F:\Final Book\Sanjay\IIIrd Printout\Dt. 10-03-09