
Page 51 - MATLAB an introduction with applications
P. 51
36 ——— MATLAB: An Introduction with Applications
9
10
8
10
7
10
6
10
5
10
4
10
3
10
2
10
0 1 2 3
10 10 10 10
Fig. E1.5 (e)
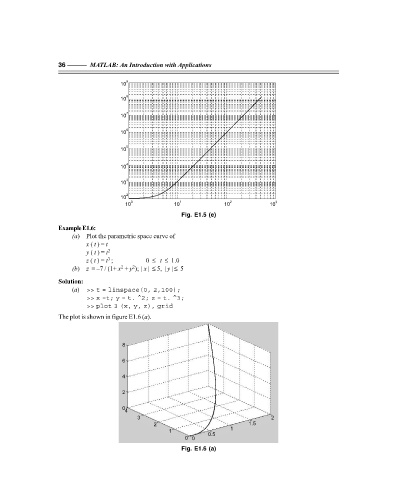
Example E1.6:
(a) Plot the parametric space curve of
x ( t ) = t
y ( t ) = t 2
3
z ( t ) = t ; 0 ≤ t ≤ 1.0
2
2
(b) z = –7 / (1+ x + y ); | x | ≤ 5, | y | ≤ 5
Solution:
(a) >> t = linspace(0, 2,100);
>> x =t; y = t. ^2; z = t. ^3;
>> plot 3 (x, y, z), grid
The plot is shown in figure E1.6 (a).
8
6
4
2
0
4
3 2
2 1.5
1
1
0.5
0 0
Fig. E1.6 (a)
F:\Final Book\Sanjay\IIIrd Printout\Dt. 10-03-09