
Page 46 - MATLAB an introduction with applications
P. 46
MATLAB Basics ——— 31
1.17.2.1 Overlay plots
There are three ways of generating overlay plots in MATLAB. They are:
(a) Plot command.
(b) Hold command.
(c) Line command.
(a) Plot command
Example E1.5(a) shows the use of plot command used with matrix argument, each column of the second
argument matrix plotted against the corresponding column of the first argument matrix.
(b) Hold command
Invoking hold on at any point during a session freezes the current plot in the graphics window. All the next
plots generated by the plot command are added to the exiting plot. See Example E1.5(a).
(c) Line command
The line command takes a pair of vectors (or a triplet in 3-D) followed by a parameter name/parameter value
pairs as argument. For instance, the command: line (x data, y data, parameter name, parameter value) adds
lines to the existing axes. See Example E1.5(a).
1.17.3 3-D Plots
MATLAB provides various options for displaying three-dimensional data. They include line and wire, surface,
mesh plots, among many others. More information can be found in the Help Window under Plotting and Data
visualization. Table 1.30 lists commonly used functions.
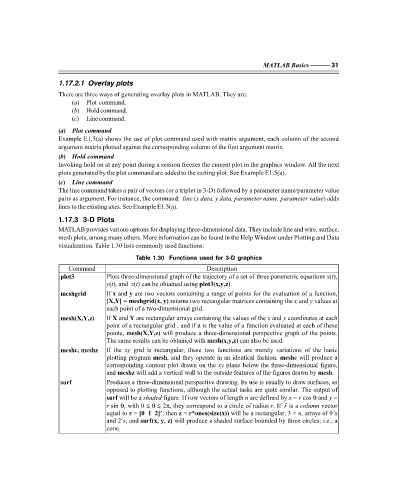
Table 1.30 Functions used for 3-D graphics
Command Description
plot3 Plots three-dimensional graph of the trajectory of a set of three parametric equations x(t),
y(t), and z(t) can be obtained using plot3(x,y,z).
meshgrid If x and y are two vectors containing a range of points for the evaluation of a function,
[X,Y] = meshgrid(x, y) returns two rectangular matrices containing the x and y values at
each point of a two-dimensional grid.
mesh(X,Y,z) If X and Y are rectangular arrays containing the values of the x and y coordinates at each
point of a rectangular grid , and if z is the value of a function evaluated at each of these
points, mesh(X,Y,z) will produce a three-dimensional perspective graph of the points.
The same results can be obtained with mesh(x,y,z) can also be used.
meshc, meshz If the xy grid is rectangular, these two functions are merely variations of the basic
plotting program mesh, and they operate in an identical fashion. meshc will produce a
corresponding contour plot drawn on the xy plane below the three-dimensional figure,
and meshz will add a vertical wall to the outside features of the figures drawn by mesh.
surf Produces a three-dimensional perspective drawing. Its use is usually to draw surfaces, as
opposed to plotting functions, although the actual tasks are quite similar. The output of
surf will be a shaded figure. If row vectors of length n are defined by x = r cos θ and y =
r sin θ, with 0 ≤ θ ≤ 2π, they correspond to a circle of radius r. If r is a column vector
equal to r = [0 1 2]’; then z = r*ones(size(x)) will be a rectangular, 3 × n, arrays of 0’s
and 2’s, and surf(x, y, z) will produce a shaded surface bounded by three circles; i.e., a
cone.
F:\Final Book\Sanjay\IIIrd Printout\Dt. 10-03-09