
Page 45 - MATLAB an introduction with applications
P. 45
30 ——— MATLAB: An Introduction with Applications
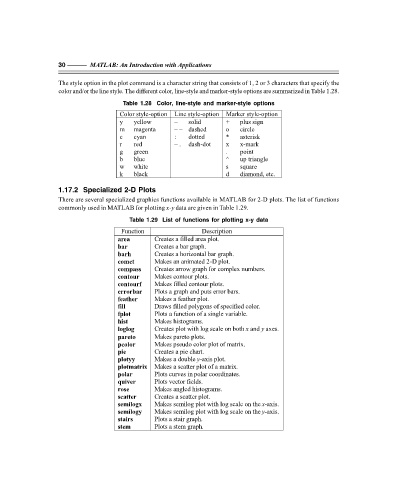
The style option in the plot command is a character string that consists of 1, 2 or 3 characters that specify the
color and/or the line style. The different color, line-style and marker-style options are summarized in Table 1.28.
Table 1.28 Color, line-style and marker-style options
Color style-option Line style-option Marker style-option
y yellow – solid + plus sign
m magenta – – dashed o circle
c cyan : dotted * asterisk
r red – . dash-dot x x-mark
g green . point
b blue ^ up triangle
w white s square
k black d diamond, etc.
1.17.2 Specialized 2-D Plots
There are several specialized graphics functions available in MATLAB for 2-D plots. The list of functions
commonly used in MATLAB for plotting x-y data are given in Table 1.29.
Table 1.29 List of functions for plotting x-y data
Function Description
area Creates a filled area plot.
bar Creates a bar graph.
barh Creates a horizontal bar graph.
comet Makes an animated 2-D plot.
compass Creates arrow graph for complex numbers.
contour Makes contour plots.
contourf Makes filled contour plots.
errorbar Plots a graph and puts error bars.
feather Makes a feather plot.
fill Draws filled polygons of specified color.
fplot Plots a function of a single variable.
hist Makes histograms.
loglog Creates plot with log scale on both x and y axes.
pareto Makes pareto plots.
pcolor Makes pseudo color plot of matrix.
pie Creates a pie chart.
plotyy Makes a double y-axis plot.
plotmatrix Makes a scatter plot of a matrix.
polar Plots curves in polar coordinates.
quiver Plots vector fields.
rose Makes angled histograms.
scatter Creates a scatter plot.
semilogx Makes semilog plot with log scale on the x-axis.
semilogy Makes semilog plot with log scale on the y-axis.
stairs Plots a stair graph.
stem Plots a stem graph.
F:\Final Book\Sanjay\IIIrd Printout\Dt. 10-03-09