
Page 120 - MATLAB Recipes for Earth Sciences
P. 120
5.6 Nonlinear Time-Series Analysis (by N. Marwan) 113
for the data set. Adding a colorbar
colorbar
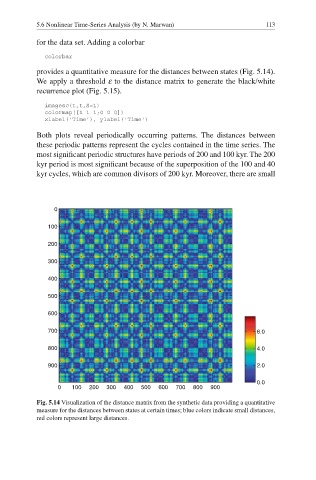
provides a quantitative measure for the distances between states (Fig. 5.14).
We apply a threshold ε to the distance matrix to generate the black/white
recurrence plot (Fig. 5.15).
imagesc(t,t,S<1)
colormap([1 1 1;0 0 0])
xlabel('Time'), ylabel('Time')
Both plots reveal periodically occurring patterns. The distances between
these periodic patterns represent the cycles contained in the time series. The
most significant periodic structures have periods of 200 and 100 kyr. The 200
kyr period is most significant because of the superposition of the 100 and 40
kyr cycles, which are common divisors of 200 kyr. Moreover, there are small
0
100
200
300
400
500
600
700 6.0
800 4.0
900 2.0
0.0
0 100 200 300 400 500 600 700 800 900
Fig. 5.14 Visualization of the distance matrix from the synthetic data providing a quantitative
measure for the distances between states at certain times; blue colors indicate small distances,
red colors represent large distances.