
Page 173 - MATLAB Recipes for Earth Sciences
P. 173
168 7 Spatial Data
generated by the user. As an example, we use the colormap hot, which is a
black-red-yellow-white colormap.
surf(XI,YI,ZI), colormap('hot'), colorbar
In this case, Rotate 3D only rotates the 3D plot, not the colorbar. The func-
tion surfc combines both a surface and a 2D contour plot in one graph.
surfc(XI,YI,ZI)
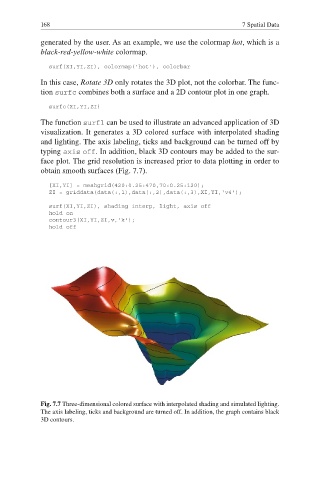
The function surfl can be used to illustrate an advanced application of 3D
visualization. It generates a 3D colored surface with interpolated shading
and lighting. The axis labeling, ticks and background can be turned off by
typing axis off. In addition, black 3D contours may be added to the sur-
face plot. The grid resolution is increased prior to data plotting in order to
obtain smooth surfaces (Fig. 7.7).
[XI,YI] = meshgrid(420:0.25:470,70:0.25:120);
ZI = griddata(data(:,1),data(:,2),data(:,3),XI,YI,'v4');
surf(XI,YI,ZI), shading interp, light, axis off
hold on
contour3(XI,YI,ZI,v,'k');
hold off
Fig. 7.7 Three-dimensional colored surface with interpolated shading and simulated lighting.
The axis labeling, ticks and background are turned off. In addition, the graph contains black
3D contours.