Page 423 -
P. 423

7-12                                                             MEMS: Design and Fabrication


                                  0.005
                                                                                (a)
                                             25°C          N  = 2×10  cm −3
                                                                    19
                                  0.004      100°C           d
                                             150°C
                                             200°C
                                             250°C
                                 dR/R  0.003
                                  0.002


                                  0.001

                                      0
                                       0           50         100         150         200
                                                                  −6
                                                          Strain (10 )

                                    −24                     N  = 2×10  cm −3    (b)
                                 Longitudinal gauge factor  −20
                                                                    19
                                    −22
                                                             d

                                    −18
                                    −16
                                    −14
                                    −12

                                    −10
                                       0       50     100     150     200     250     300
                                                        Temperature (°C)


                                     18       25°C                              (c)
                                     16
                                 Net bridge output (mV)  12  150°C
                                     14
                                              100°C
                                              200°C
                                              250°C
                                     10
                                      8
                                      6
                                      4
                                      2
                                      0
                                       0     5    10    15    20    25    30    35
                                                          Pressure (psi)
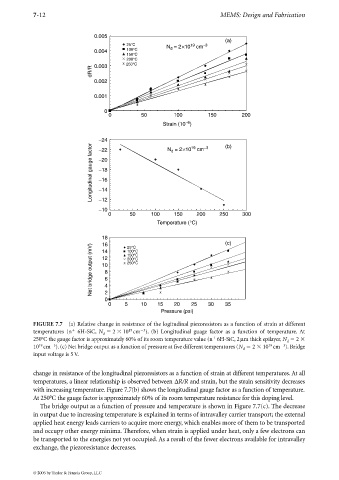
             FIGURE 7.7 (a) Relative change in resistance of the logitudinal piezoresistors as a function of strain at different

                                                   3
                                              19
             temperatures  (n 6H-SiC, N   2   10 cm ). (b) Longitudinal  guage  factor  as  a  function  of temperature. At
                                     d

             250°C the gauge factor is approximately 60% of its room temperature value (n 6H-SiC, 2µm thick epilayer, N   2
                                                                                                      d
                                                                                               19
                                                                                                    3
               19
                    3
             10 cm ). (c) Net bridge output as a function of pressure at five different temperatures (N   2   10 cm ). Bridge
                                                                                      d
             input voltage is 5V.
             change in resistance of the longitudinal piezoresistors as a function of strain at different temperatures. At all
             temperatures, a linear relationship is observed between ∆R/R and strain, but the strain sensitivity decreases
             with increasing temperature. Figure 7.7(b) shows the longitudinal gauge factor as a function of temperature.
             At 250°C the gauge factor is approximately 60% of its room temperature resistance for this doping level.
               The bridge output as a function of pressure and temperature is shown in Figure 7.7(c). The decrease
             in output due to increasing temperature is explained in terms of intravalley carrier transport; the external
             applied heat energy leads carriers to acquire more energy, which enables more of them to be transported
             and occupy other energy minima. Therefore, when strain is applied under heat, only a few electrons can
             be transported to the energies not yet occupied. As a result of the fewer electrons available for intravalley
             exchange, the piezoresistance decreases.


             © 2006 by Taylor & Francis Group, LLC
   418   419   420   421   422   423   424   425   426   427   428