
Page 422 -
P. 422
Single-Crystal Silicon Carbide MEMS: Fabrication, Characterization, and Reliability 7-11
Based on the above analysis, it becomes possible to calculate the GF of the 6H-SiC material, because there
is a direct relationship between the applied strain and the gauge factor, as indicated in Equation (7.1).
The GF and Temperature Coefficient of Resistance (TCR) of n-type 6H-SiC were analyzed in the basal
(0001)-plane. The characteristics of 6H-SiC piezoresistors were established individually in a four-arm
Wheatstone bridge. The load on the beam was applied through pressure exerted on the metallic diaphragm
previously described and transmitted by the boss acting as a push rod to the beam. Patterned strain
gauges were fabricated in homoepitaxially grown, 2 µm, n-type epilayers on p-type 6H-SiC substrates
3
18
17
with two n-type doping levels, namely: 2 10 cm 3 and 3 10 cm .In hexagonal crystals, because
the piezoresistance tensor is isotropic in the basal (0001)-plane, the gauge can be rotated about the c-axis
without affecting the piezoresistivity [Davis et al., 1988]. Longitudinal and transverse gauges were mea-
sured, which yielded results corresponding to the piezoresistive coefficients π and π ,respectively.
11 12
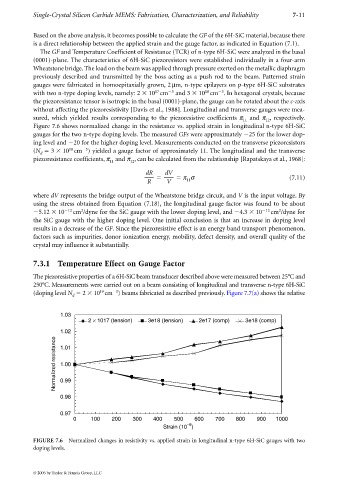
Figure 7.6 shows normalized change in the resistance vs. applied strain in longitudinal n-type 6H-SiC
gauges for the two n-type doping levels. The measured GFs were approximately 25 for the lower dop-
ing level and 20 for the higher doping level. Measurements conducted on the transverse piezoresistors
18
3
(N 3 10 cm )yielded a gauge factor of approximately 11. The longitudinal and the transverse
d
piezoresistance coefficients, π and π , can be calculated from the relationship [Rapatskaya et al., 1968]:
11 12
dR dV
π σ (7.11)
R V 11
where dV represents the bridge output of the Wheatstone bridge circuit, and V is the input voltage. By
using the stress obtained from Equation (7.18), the longitudinal gauge factor was found to be about
2
2
5.12 10 12 cm /dyne for the SiC gauge with the lower doping level, and 4.3 10 12 cm /dyne for
the SiC gauge with the higher doping level. One initial conclusion is that an increase in doping level
results in a decrease of the GF.Since the piezoresistive effect is an energy band transport phenomenon,
factors such as impurities, donor ionization energy, mobility, defect density, and overall quality of the
crystal may influence it substantially.
7.3.1 Temperature Effect on Gauge Factor
The piezoresistive properties of a 6H-SiC beam transducer described above were measured between 25°C and
250°C. Measurements were carried out on a beam consisting of longitudinal and transverse n-type 6H-SiC
19
3
(doping level N 2 10 cm ) beams fabricated as described previously. Figure 7.7(a) shows the relative
d
1.03
2 × 10¹⁷ (tension) 3e18 (tension) 2e17 (comp) 3e18 (comp)
1.02
Normalized resistance 1.01
1.00
0.99
0.98
0.97
0 100 200 300 400 500 600 700 800 900 1000
−6
Strain (10 )
FIGURE 7.6 Normalized changes in resistivity vs. applied strain in longitudinal n-type 6H-SiC gauges with two
doping levels.
© 2006 by Taylor & Francis Group, LLC