
Page 99 - Macromolecular Crystallography
P. 99
88 MACROMOLECULAR CRYS TALLOGRAPHY
IA VIIA VIIIA
1 1 2
H IIA IIIA IVA VA VIA H He
3 4 5 6 7 8 9 10
Li Be B C N 0 F Ne
11 12 VIII 13 14 15 16 17 18
Na Mg IIIB IVB VB VIB VIIB IB IIB Al Si P S Cl Ar
19 20 21 22 23 24 25 26 27 28 29 30 31 32 33 34 35 36
K Ca Sc Ti V Cr Mn Fe Co Ni Cu Zn Ga Ge As Se Br Kr
37 38 39 40 41 42 43 44 45 46 47 48 49 50 51 52 53 54
Rb Sr Y Zr Nb Mo Tc Ru Rh Pd Ag Cd In Sn Sb Te I Xe
55 56 57 72 73 74 75 76 77 78 79 80 81 82 83 84 85 86
Cs Ba #La Hf Ta W Re Os Ir Pt Au Hg TI Pb Bi Po At Rn
87 88 89 104 105 106 107 108 109 110 111 112 113 114 115 116 117 118
Fr Ra *Ac Rf Db Sg Bh Hs Mt Ds Rg Uub Uut Uuq Uup Uuh Uus Uuc
58 59 60 61 62 63 64 65 66 67 68 69 70 71
#Lanthanides Ce Pr Nd Pm Sm Eu Gd Tb Dy Ho Er Tm Yb Lu
90 91 92 93 94 95 96 97 98 99 100 101 102 103
*Actinides
Th Pa U Np Pu Am Cm Bk Cf Es Fm Md No Lr
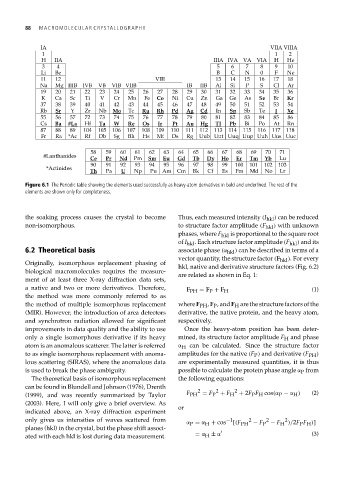
Figure 6.1 The Periodic table showing the elements used successfully as heavy-atom derivatives in bold and underlined. The rest of the
elements are shown only for completeness.
the soaking process causes the crystal to become Thus, each measured intensity (I hkl ) can be reduced
non-isomorphous. to structure factor amplitude (F hkl ) with unknown
phases, where F hkl is proportional to the square root
of I hkl . Each structure factor amplitude (F hkl ) and its
6.2 Theoretical basis associate phase (α hkl ) can be described in terms of a
vector quantity, the structure factor (F hkl ). For every
Originally, isomorphous replacement phasing of
hkl, native and derivative structure factors (Fig. 6.2)
biological macromolecules requires the measure-
are related as shown in Eq. 1:
ment of at least three X-ray diffraction data sets,
a native and two or more derivatives. Therefore, (1)
F PH = F P + F H
the method was more commonly referred to as
the method of multiple isomorphous replacement where F PH , F P , and F H are the structure factors of the
(MIR). However, the introduction of area detectors derivative, the native protein, and the heavy atom,
and synchrotron radiation allowed for significant respectively.
improvements in data quality and the ability to use Once the heavy-atom position has been deter-
only a single isomorphous derivative if its heavy mined, its structure factor amplitude F H and phase
atom is an anomalous scatterer. The latter is referred α H can be calculated. Since the structure factor
to as single isomorphous replacement with anoma- amplitudes for the native (F P ) and derivative (F PH )
lous scattering (SIRAS), where the anomalous data are experimentally measured quantities, it is thus
is used to break the phase ambiguity. possible to calculate the protein phase angle α P from
The theoretical basis of isomorphous replacement the following equations:
can be found in Blundell and Johnson (1976), Drenth 2 2 2
(1999), and was recently summarized by Taylor F PH = F P + F H + 2F P F H cos(α P − α H ) (2)
(2003). Here, I will only give a brief overview. As
or
indicated above, an X-ray diffraction experiment
only gives us intensities of waves scattered from α P = α H + cos −1 [(F PH − F P − F H )/2F P F H )]
2
2
2
planes (hkl) in the crystal, but the phase shift associ-
ated with each hkl is lost during data measurement. = α H ± α (3)