
Page 300 - Managing Global Warming
P. 300
260 Managing Global Warming
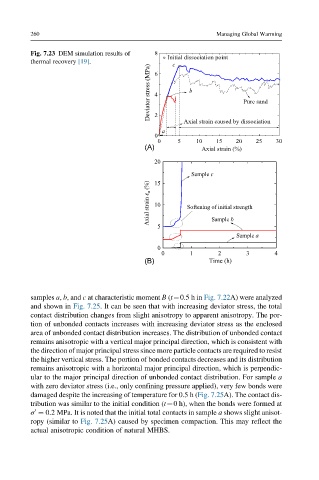
Fig. 7.23 DEM simulation results of 8
Initial dissociation point
thermal recovery [19]. 6 c
Deviator stress (MPa) 4 b Pure sand
2
Axial strain caused by dissociation
a
0
0 5 10 15 20 25 30
(A) Axial strain (%)
20
Sample c
Axial strain e a (%) 10 Softening of initial strength
15
5 Sample b
Sample a
0
0 1 2 3 4
(B) Time (h)
samples a, b, and c at characteristic moment B (t¼0.5 h in Fig. 7.22A) were analyzed
and shown in Fig. 7.25. It can be seen that with increasing deviator stress, the total
contact distribution changes from slight anisotropy to apparent anisotropy. The por-
tion of unbonded contacts increases with increasing deviator stress as the enclosed
area of unbonded contact distribution increases. The distribution of unbonded contact
remains anisotropic with a vertical major principal direction, which is consistent with
the direction of major principal stress since more particle contacts are required to resist
the higher vertical stress. The portion of bonded contacts decreases and its distribution
remains anisotropic with a horizontal major principal direction, which is perpendic-
ular to the major principal direction of unbonded contact distribution. For sample a
with zero deviator stress (i.e., only confining pressure applied), very few bonds were
damaged despite the increasing of temperature for 0.5 h (Fig. 7.25A). The contact dis-
tribution was similar to the initial condition (t¼0 h), when the bonds were formed at
0
σ ¼ 0.2 MPa. It is noted that the initial total contacts in sample a shows slight anisot-
ropy (similar to Fig. 7.25A) caused by specimen compaction. This may reflect the
actual anisotropic condition of natural MHBS.