
Page 302 - Managing Global Warming
P. 302
262 Managing Global Warming
8E–005 0.2 2.6
7E–005 0.18 2.4
2.2
6E–005 0.16 2
5E–005 0.14 1.8
4E–005 0.12 1.6
3E–005 0.1 1.4
2E–005 0.08 1.2
1
1E–005 0.06 0.8
0 0.04 0.6
–1E–005 0.02 0.4
–2E–005 0 0.2
–3E–005 –0.02 0
–4E–005 –0.04 –0.
–0.
–5E–005 –0.06 –0.
–6E–005 –0.08 –0.
–7E–005 –0.1 –1.
–8E–005 –0.12 –1.
A (t = 0 h) B (t =0.5 h) C (t=2 h)
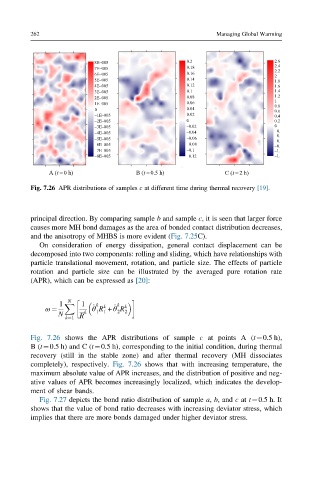
Fig. 7.26 APR distributions of samples c at different time during thermal recovery [19].
principal direction. By comparing sample b and sample c, it is seen that larger force
causes more MH bond damages as the area of bonded contact distribution decreases,
and the anisotropy of MHBS is more evident (Fig. 7.25C).
On consideration of energy dissipation, general contact displacement can be
decomposed into two components: rolling and sliding, which have relationships with
particle translational movement, rotation, and particle size. The effects of particle
rotation and particle size can be illustrated by the averaged pure rotation rate
(APR), which can be expressed as [20]:
N
1 X 1 k k k k
_
_
ω ¼ k θ R + θ R
1 1
2 2
N k¼1 R
Fig. 7.26 shows the APR distributions of sample c at points A (t¼0.5 h),
B(t¼0.5 h) and C (t¼0.5 h), corresponding to the initial condition, during thermal
recovery (still in the stable zone) and after thermal recovery (MH dissociates
completely), respectively. Fig. 7.26 shows that with increasing temperature, the
maximum absolute value of APR increases, and the distribution of positive and neg-
ative values of APR becomes increasingly localized, which indicates the develop-
ment of shear bands.
Fig. 7.27 depicts the bond ratio distribution of sample a, b, and c at t¼0.5 h. It
shows that the value of bond ratio decreases with increasing deviator stress, which
implies that there are more bonds damaged under higher deviator stress.