
Page 301 - Managing Global Warming
P. 301
Methane hydrate as a “new energy” 261
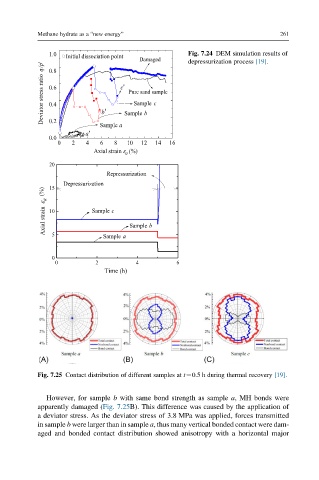
1.0 Initial dissociation point Damaged Fig. 7.24 DEM simulation results of
depressurization process [19].
Deviator stress ratio q/p' 0.6 b' c' Sample b
0.8
Pure sand sample
Sample c
0.4
0.2
a' Sample a
0.0
0 2 4 6 8 10 12 14 16
Axial strain e (%)
a
20
Repressurization
Depressurization
15
(%)
a
Axial strain 10 5 Sample c Sample b
Sample a
0
0 2 4 6
Time (h)
Fig. 7.25 Contact distribution of different samples at t¼0.5 h during thermal recovery [19].
However, for sample b with same bond strength as sample a, MH bonds were
apparently damaged (Fig. 7.25B). This difference was caused by the application of
a deviator stress. As the deviator stress of 3.8 MPa was applied, forces transmitted
in sample b were larger than in sample a, thus many vertical bonded contact were dam-
aged and bonded contact distribution showed anisotropy with a horizontal major