
Page 415 - 04. Subyek Engineering Materials - Manufacturing, Engineering and Technology SI 6th Edition - Serope Kalpakjian, Stephen Schmid (2009)
P. 415
Section 16.4 Formability Tests for Sheet Metals
1 I 2 I ji 4
____
P““°h l°'°e
Bianknoider
7
e'ss
,, ;; ';;¢ , iff
figs. lv ;22Z2fl;f?§f f@f`§ [,
(H) (bl
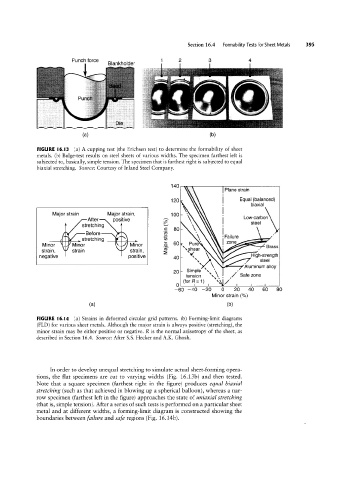
FIGURE l6.I3 (a) A cupping test (the Erichsen test) to determine the formability of sheet
metals. (b) Bulge-test results on steel sheets of various widths. The specimen farthest left is
subjected to, basically, simple tension. The specimen that is farthest right is subjected to equal
biaxial stretching. Source: Courtesy of Inland Steel Company.
140
I Plane strain
120 Equal (balanced)
biaxial
Major strain Major strain, 100- »
After positive Lowfazbon
Q*
stretching 8O_ \ S ee
Before Q ‘ _F _I ,
stretching _g \ gggge
Q
Minor Minor Minor 60 Pure Brass
strain, strain strain, gl `§:‘fal \ '
x/
negative positive 40 _ \` \ O HIQN-Strength
steel
S_ ` Aluminum alloy
_ imp e ~ »
20 tension \§` O/ Safe zone
O (lol Fl: ll `§l/
-60 -40 -20 0 20 40 GO 80
Minor strain (%)
(H) (bl
FIGURE l6.l4 (a) Strains in deformed circular grid patterns. (b) Forming-limit diagrams
(FLD) for various sheet metals. Although the major strain is always positive (stretching), the
minor strain may be either positive or negative. R is the normal anisotropy of the sheet, as
described in Section 16.4. Source: After S.S. Hecker and A.K. Ghosh.
In order to develop unequal stretching to simulate actual sheet-forming opera-
tions, the flat specimens are cut to varying widths (Fig. 16.13b) and then tested.
Note that a square specimen (farthest right in the figure) produces equal biaxial
stretching (such as that achieved in blowing up a spherical balloon), whereas a nar-
row specimen (farthest left in the figure) approaches the state of uniaxial stretching
(that is, simple tension). After a series of such tests is performed on a particular sheet
metal and at different widths, a forming-limit diagram is constructed showing the
boundaries between failure and safe regions (Fig. 16.14b).