
Page 416 - 04. Subyek Engineering Materials - Manufacturing, Engineering and Technology SI 6th Edition - Serope Kalpakjian, Stephen Schmid (2009)
P. 416
396 Chapter 16 Sheet-Metal Forming Processes and Equipment
In order to develop a forming-limit diagram, the
major and minor engineering strains, as measured
from the deformation of the original circles, are ob-
tained. Note in Fig. 16.14a that the original circle has
deformed into an ellipse. The major axis of the ellipse
represents the major direction and magnitude of
stretching. The major strain is the engineering strain in
this direction and is always positive, because the sheet
is being stretched. The minor axis of the ellipse repre-
sents the magnitude of the stretching or shrinking in
the transverse direction.
Note that the minor strain can be either positive
or negative. For example, if a circle is placed in the
center of a tensile-test specimen and then stretched
uniaxially (simple tension), the specimen becomes nar-
rower as it is stretched (due to the Poisson effect), and
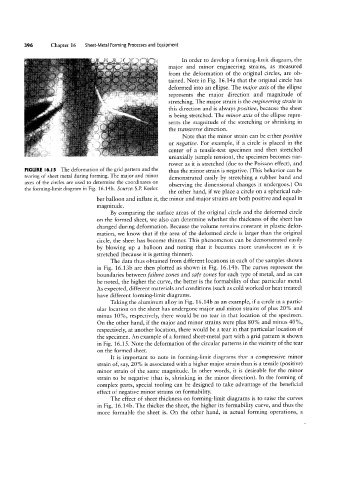
FIGURE I6.l5 The deformation of the grid pattern and the thus the minor strain is negative. (This behavior can be
tearing of sheet metal during forming. The major and minor demonstrated easily by stretching a rubber band and
axes of the circles are used to determine the coordinates on observing the dimensional changes it undergoes.) On
the forming-limit diagram in Fig. 16.14b. Source: S.P. Keeler.
the other hand, if we place a circle on a spherical rub-
ber balloon and inflate it, the minor and major strains are both positive and equal in
magnitude.
By comparing the surface areas of the original circle and the deformed circle
on the formed sheet, we also can determine whether the thickness of the sheet has
changed during deformation. Because the volume remains constant in plastic defor-
mation, we know that if the area of the deformed circle is larger than the original
circle, the sheet has become thinner. This phenomenon can be demonstrated easily
by blowing up a balloon and noting that it becomes more translucent as it is
stretched (because it is getting thinner).
The data thus obtained from different locations in each of the samples shown
in Fig. 16.13b are then plotted as shown in Fig. 16.14b. The curves represent the
boundaries between failure zones and safe zones for each type of metal, and as can
be noted, the higher the curve, the better is the formability of that particular metal.
As expected, different materials and conditions (such as cold worked or heat treated)
have different forming-limit diagrams.
Taking the aluminum alloy in Fig. 16.14b as an example, if a circle in a partic-
ular location on the sheet has undergone major and minor strains of plus 20% and
minus 10%, respectively, there would be no tear in that location of the specimen.
On the other hand, if the major and minor strains were plus 80% and minus 40%,
respectively, at another location, there would be a tear in that particular location of
the specimen. An example of a formed sheet-metal part with a grid pattern is shown
in Fig. 16.15. Note the deformation of the circular patterns in the vicinity of the tear
on the formed sheet.
It is important to note in forming-limit diagrams that a compressive minor
strain of, say, 20% is associated with a higher major strain than is a tensile (positive)
minor strain of the same magnitude. In other words, it is desirable for the minor
strain to be negative (that is, shrinking in the minor direction). In the forming of
complex parts, special tooling can be designed to take advantage of the beneficial
effect of negative minor strains on formability.
The effect of sheet thickness on forming-limit diagrams is to raise the curves
in Fig. 16.14b. The thicker the sheet, the higher its formability curve, and thus the
more formable the sheet is. On the other hand, in actual forming operations, a