
Page 421 - Marketing Management
P. 421
398 PART 5 SHAPING THE MARKET OFFERINGS
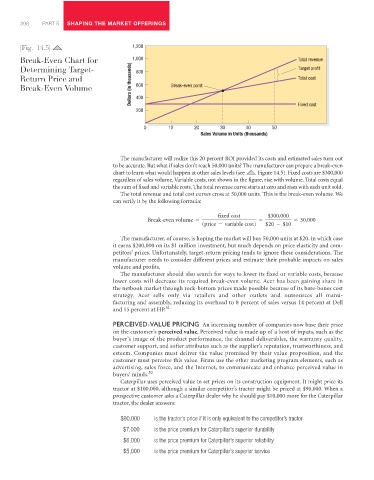
|Fig. 14.5| 1,200
Break-Even Chart for 1,000 Total revenue
Dollars (in thousands) 600 Break-even point
Determining Target- 800 Target profit
Return Price and Total cost
Break-Even Volume 400
200 Fixed cost
0 10 20 30 40 50
Sales Volume in Units (thousands)
The manufacturer will realize this 20 percent ROI provided its costs and estimated sales turn out
to be accurate. But what if sales don’t reach 50,000 units? The manufacturer can prepare a break-even
chart to learn what would happen at other sales levels (see Figure 14.5). Fixed costs are $300,000
regardless of sales volume. Variable costs, not shown in the figure, rise with volume. Total costs equal
the sum of fixed and variable costs. The total revenue curve starts at zero and rises with each unit sold.
The total revenue and total cost curves cross at 30,000 units. This is the break-even volume. We
can verify it by the following formula:
fixed cost $300,000
Break-even volume = = = 30,000
(price - variable cost) $20 - $10
The manufacturer, of course, is hoping the market will buy 50,000 units at $20, in which case
it earns $200,000 on its $1 million investment, but much depends on price elasticity and com-
petitors’ prices. Unfortunately, target-return pricing tends to ignore these considerations. The
manufacturer needs to consider different prices and estimate their probable impacts on sales
volume and profits.
The manufacturer should also search for ways to lower its fixed or variable costs, because
lower costs will decrease its required break-even volume. Acer has been gaining share in
the netbook market through rock-bottom prices made possible because of its bare-bones cost
strategy. Acer sells only via retailers and other outlets and outsources all manu-
facturing and assembly, reducing its overhead to 8 percent of sales versus 14 percent at Dell
and 15 percent at HP. 51
PERCEIVED-VALUE PRICING An increasing number of companies now base their price
on the customer’s perceived value. Perceived value is made up of a host of inputs, such as the
buyer’s image of the product performance, the channel deliverables, the warranty quality,
customer support, and softer attributes such as the supplier’s reputation, trustworthiness, and
esteem. Companies must deliver the value promised by their value proposition, and the
customer must perceive this value. Firms use the other marketing program elements, such as
advertising, sales force, and the Internet, to communicate and enhance perceived value in
buyers’ minds. 52
Caterpillar uses perceived value to set prices on its construction equipment. It might price its
tractor at $100,000, although a similar competitor’s tractor might be priced at $90,000. When a
prospective customer asks a Caterpillar dealer why he should pay $10,000 more for the Caterpillar
tractor, the dealer answers:
$90,000 is the tractor’s price if it is only equivalent to the competitor’s tractor
$7,000 is the price premium for Caterpillar’s superior durability
$6,000 is the price premium for Caterpillar’s superior reliability
$5,000 is the price premium for Caterpillar’s superior service