
Page 416 - Marketing Management
P. 416
DEVELOPING PRICING STRATEGIES AND PROGRAMS | CHAPTER 14 393
TYPES OF COSTS AND LEVELS OF PRODUCTION A company’s costs take two forms, (a) Cost Behavior in
fixed and variable. Fixed costs, also known as overhead, are costs that do not vary with production a Fixed-Size Plant
level or sales revenue. A company must pay bills each month for rent, heat, interest, salaries, and so
on regardless of output.
Variable costs vary directly with the level of production. For example, each hand calculator pro- SRAC
duced by Texas Instruments incurs the cost of plastic, microprocessor chips, and packaging. These
costs tend to be constant per unit produced, but they’re called variable because their total varies Cost per Unit
with the number of units produced.
Total costs consist of the sum of the fixed and variable costs for any given level of production.
Average cost is the cost per unit at that level of production; it equals total costs divided by produc-
tion. Management wants to charge a price that will at least cover the total production costs at a
1,000
given level of production.
Quantity Produced per Day
To price intelligently, management needs to know how its costs vary with different levels of pro-
duction. Take the case in which a company such as TI has built a fixed-size plant to produce 1,000
hand calculators a day. The cost per unit is high if few units are produced per day. As production (b) Cost Behavior over
Different-Size Plants
approaches 1,000 units per day, the average cost falls because the fixed costs are spread over more
units. Short-run average cost increases after 1,000 units, however, because the plant becomes ineffi-
1 SRAC
cient: Workers must line up for machines, getting in each other’s way, and machines break down 2
3 4
more often (see Figure 14.2(a)).
If TI believes it can sell 2,000 units per day, it should consider building a larger plant. The
plant will use more efficient machinery and work arrangements, and the unit cost of produc- Cost per Unit LRAC
ing 2,000 calculators per day will be lower than the unit cost of producing 1,000 per day. This
is shown in the long-run average cost curve (LRAC) in Figure 14.2(b). In fact, a 3,000-capacity
plant would be even more efficient according to Figure 14.2(b), but a 4,000-daily production
plant would be less so because of increasing diseconomies of scale: There are too many work- 1,000 2,000 3,000 4,000
ers to manage, and paperwork slows things down. Figure 14.2(b) indicates that a 3,000-daily
Quantity Produced per Day
production plant is the optimal size if demand is strong enough to support this level of
production. |Fig. 14.2|
There are more costs than those associated with manufacturing. To estimate the real prof- Cost per Unit at
itability of selling to different types of retailers or customers, the manufacturer needs to use
activity-based cost (ABC) accounting instead of standard cost accounting, as described in Different Levels of
Chapter 5. Production per Period
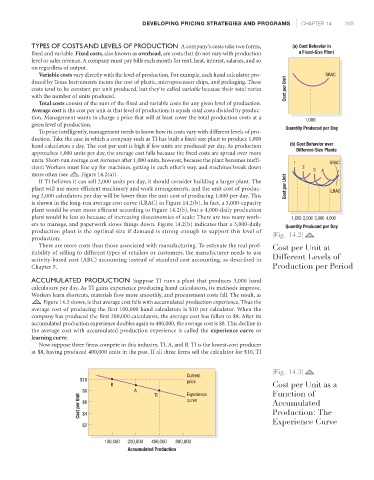
ACCUMULATED PRODUCTION Suppose TI runs a plant that produces 3,000 hand
calculators per day. As TI gains experience producing hand calculators, its methods improve.
Workers learn shortcuts, materials flow more smoothly, and procurement costs fall. The result, as
Figure 14.3 shows, is that average cost falls with accumulated production experience. Thus the
average cost of producing the first 100,000 hand calculators is $10 per calculator. When the
company has produced the first 200,000 calculators, the average cost has fallen to $9. After its
accumulated production experience doubles again to 400,000, the average cost is $8. This decline in
the average cost with accumulated production experience is called the experience curve or
learning curve.
Now suppose three firms compete in this industry, TI, A, and B. TI is the lowest-cost producer
at $8, having produced 400,000 units in the past. If all three firms sell the calculator for $10, TI
|Fig. 14.3|
Current
$10 price
B Cost per Unit as a
$8 A TI Experience Function of
Cost per Unit $6 curve Accumulated
Production: The
$4
Experience Curve
$2
100,000 200,000 400,000 800,000
Accumulated Production