Page 129 - Marks Calculation for Machine Design
P. 129

P1: Sanjay
                          January 4, 2005
                                      16:18
        Brown.cls
                 Brown˙C02
                                      A
                            A  = 0  C  = C       BEAMS              C             111
                             x
                                   A  = 0
                                    y
                            FIGURE 2.98  Free-body-diagram.
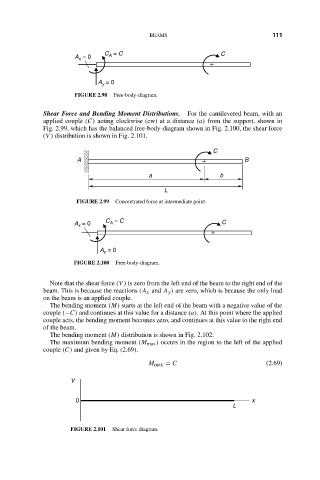
                    Shear Force and Bending Moment Distributions.  For the cantilevered beam, with an
                    applied couple (C) acting clockwise (cw) at a distance (a) from the support, shown in
                    Fig. 2.99, which has the balanced free-body-diagram shown in Fig. 2.100, the shear force
                    (V ) distribution is shown in Fig. 2.101.
                                                                  C
                             A                                            B

                                                a                   b
                                                     L
                             FIGURE 2.99  Concentrated force at intermediate point.

                                     C  = C
                            A  = 0    A                             C
                             x

                                   A  = 0
                                    y
                            FIGURE 2.100  Free-body-diagram.


                      Note that the shear force (V ) is zero from the left end of the beam to the right end of the
                    beam. This is because the reactions (A x and A y ) are zero, which is because the only load
                    on the beam is an applied couple.
                      The bending moment (M) starts at the left end of the beam with a negative value of the
                    couple (−C) and continues at this value for a distance (a). At this point where the applied
                    couple acts, the bending moment becomes zero, and continues at this value to the right end
                    of the beam.
                      The bending moment (M) distribution is shown in Fig. 2.102.
                      The maximum bending moment (M max ) occurs in the region to the left of the applied
                    couple (C) and given by Eq. (2.69).
                                                M max = C                       (2.69)

                           V


                             0                                              x
                                                                       L


                           FIGURE 2.101  Shear force diagram.
   124   125   126   127   128   129   130   131   132   133   134