Page 229 - Marks Calculation for Machine Design
P. 229

P1: Shibu/Sanjay
                          January 4, 2005
                 Brown˙C05
        Brown.cls
                                     PRINCIPAL STRESSES AND MOHR’S CIRCLE
                                      t 14:35                                     211
                                      min
                                           (s ,-t )
                                               xy
                                            yy
                                                     R = t max
                                                                 s
                                          s 2     s avg    s 1
                                                               2f p
                                                    (s ,t )
                                                     xx xy
                                     t max
                                          t  (2q ccw)     2f s
                          FIGURE 5.15  Maximum shear stress angle (φ s ).
                      Due to the graphical nature of the process, the following example will be presented first
                    in the U.S. Customary system of units and then in the SI/metric system.

                                              U.S. Customary
                    Example 1. Using the stresses below from Example 5, determine the principal stresses,
                    maximum and minimum shear stresses, and rotation angles by the Mohr’s circle process.
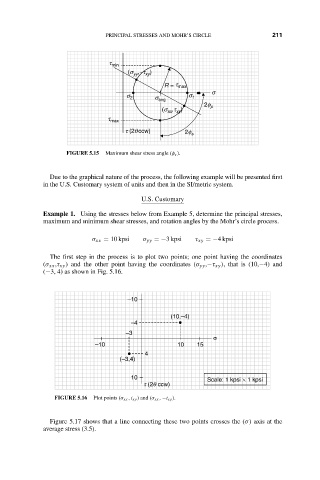
                                 σ xx = 10 kpsi  σ yy =−3 kpsi  τ xy =−4 kpsi


                      The first step in the process is to plot two points; one point having the coordinates
                    (σ xx ,τ xy ) and the other point having the coordinates (σ yy ,−τ xy ), that is (10,−4) and
                    (−3, 4) as shown in Fig. 5.16.


                                           –10

                                                      (10,–4)
                                            –4
                                          –3
                                                                  σ
                                  –10                   10   15
                                               4
                                         (–3,4)

                                            10                  Scale: 1 kpsi × 1 kpsi
                                               t (2q ccw)
                       FIGURE 5.16  Plot points (σ xx , t xy ) and (σ xx , −t xy ).


                      Figure 5.17 shows that a line connecting these two points crosses the (σ) axis at the
                    average stress (3.5).
   224   225   226   227   228   229   230   231   232   233   234