
Page 226 - Marks Calculation for Machine Design
P. 226
P1: Shibu/Sanjay
January 4, 2005
14:35
Brown.cls
Brown˙C05
STRENGTH OF MACHINES
208
t min
R = t max 2q
s
s 2 s 1
s avg
–2q
t max
t (2q ccw)
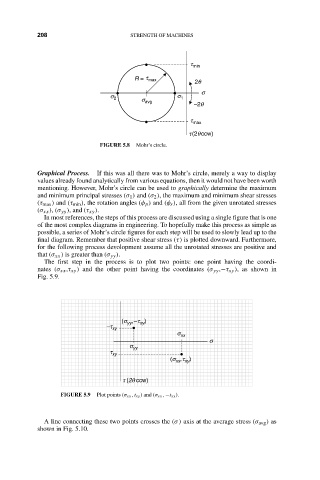
FIGURE 5.8 Mohr’s circle.
Graphical Process. If this was all there was to Mohr’s circle, merely a way to display
values already found analytically from various equations, then it would not have been worth
mentioning. However, Mohr’s circle can be used to graphically determine the maximum
and minimum principal stresses (σ 1 ) and (σ 2 ), the maximum and minimum shear stresses
(τ max ) and (τ min ), the rotation angles (φ p ) and (φ s ), all from the given unrotated stresses
(σ xx ),(σ yy ), and (τ xy ).
In most references, the steps of this process are discussed using a single figure that is one
of the most complex diagrams in engineering. To hopefully make this process as simple as
possible, a series of Mohr’s circle figures for each step will be used to slowly lead up to the
final diagram. Remember that positive shear stress (τ) is plotted downward. Furthermore,
for the following process devolopment assume all the unrotated stresses are positive and
that (σ xx ) is greater than (σ yy ).
The first step in the process is to plot two points: one point having the coordi-
nates (σ xx ,τ xy ) and the other point having the coordinates (σ yy ,−τ xy ), as shown in
Fig. 5.9.
(s , –t )
xy
yy
-t xy
s xx
s
s yy
t xy
(s , t )
xy
xx
t (2q ccw)
FIGURE 5.9 Plot points (σ xx , t xy ) and (σ xx , −t xy ).
A line connecting these two points crosses the (σ) axis at the average stress (σ avg ) as
shown in Fig. 5.10.