
Page 254 - Marks Calculation for Machine Design
P. 254
P1: Shibu
January 4, 2005
14:56
Brown.cls
Brown˙C06
STRENGTH OF MACHINES
236
in Eq. (6.3).
σ 1 − σ 2
τ max = (6.3)
2
From the tensile test that determines the yield strength (S y ), the maximum principal stress
(σ 1 ) is equal to the yield strength and the minimum principal stress (σ 2 ) is zero. So the
maximum shear stress in Eq. (6.3) becomes
σ 1 − σ 2 S y − 0 S y
τ max = = = = S sy (6.4)
2 2 2
where (S sy ) is the yield strength in shear of the material.
Eq. (6.4) can be used to establish the boundary of the maximum-shear-stress theory, given
mathematically in the second expression of Eq. (6.5) as
σ 1 − σ 2 S y
< → σ 1 − σ 2 < S y (6.5)
2 2
◦
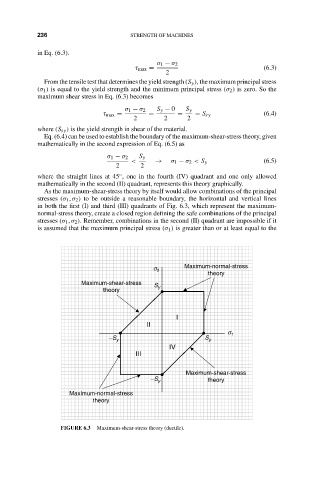
where the straight lines at 45 , one in the fourth (IV) quadrant and one only allowed
mathematically in the second (II) quadrant, represents this theory graphically.
As the maximum-shear-stress theory by itself would allow combinations of the principal
stresses (σ 1 , σ 2 ) to be outside a reasonable boundary, the horizontal and vertical lines
in both the first (I) and third (III) quadrants of Fig. 6.3, which represent the maximum-
normal-stress theory, create a closed region defining the safe combinations of the principal
stresses (σ 1 , σ 2 ). Remember, combinations in the second (II) quadrant are impossible if it
is assumed that the maximum principal stress (σ 1 ) is greater than or at least equal to the
s 2 Maximum-normal-stress
theory
Maximum-shear-stress S
theory y
I
II
s 1
–S y S y
IV
III
Maximum-shear-stress
–S y theory
Maximum-normal-stress
theory
FIGURE 6.3 Maximum-shear-stress theory (ductile).