Page 256 - Marks Calculation for Machine Design
P. 256

P1: Shibu
                          January 4, 2005
                                      14:56
        Brown.cls
                 Brown˙C06
                                           STRENGTH OF MACHINES
                  238
                  showninFig. 6.3,whichisacombinationofthe maximum-normal-stress theoryin quadrants
                  (I) and (III) and the maximum-shear-stress theory in quadrants (II) and (IV).
                    The factor-of-safety (n) for this theory is given in Eq. (6.9), which replaces the inequality
                  sign in Eq. (6.8) with an equal to sign and is then rearranged to give
                                                        1/2
                                           2   2

                                          σ + σ − σ 1 σ 2  1
                                           1   2
                                                         =                     (6.9)
                                                S y        n
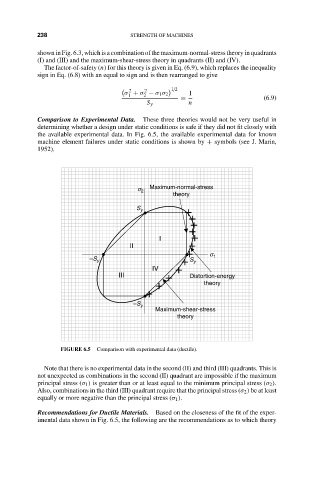
                  Comparison to Experimental Data.  These three theories would not be very useful in
                  determining whether a design under static conditions is safe if they did not fit closely with
                  the available experimental data. In Fig. 6.5, the available experimental data for known
                  machine element failures under static conditions is shown by + symbols (see J. Marin,
                  1952).
                                             s 2  Maximum-normal-stress
                                                       theory
                                             S y          +
                                                           +
                                                            +
                                                           +
                                                   I        +
                                           II              +
                                                          +      s
                                –S y                     + S y    1
                                                 IV     +
                                        III          +     Distortion-energy
                                                  +            theory
                                                +
                                            –S y
                                                  Maximum-shear-stress
                                                        theory


                         FIGURE 6.5  Comparison with experimental data (ductile).

                    Note that there is no experimental data in the second (II) and third (III) quadrants. This is
                  not unexpected as combinations in the second (II) quadrant are impossible if the maximum
                  principal stress (σ 1 ) is greater than or at least equal to the minimum principal stress (σ 2 ).
                  Also, combinations in the third (III) quadrant require that the principal stress (σ 2 ) be at least
                  equally or more negative than the principal stress (σ 1 ).

                  Recommendations for Ductile Materials.  Based on the closeness of the fit of the exper-
                  imental data shown in Fig. 6.5, the following are the recommendations as to which theory
   251   252   253   254   255   256   257   258   259   260   261