
Page 179 - Materials Science and Engineering An Introduction
P. 179
5.5 Factors that Influence Diffusion • 151
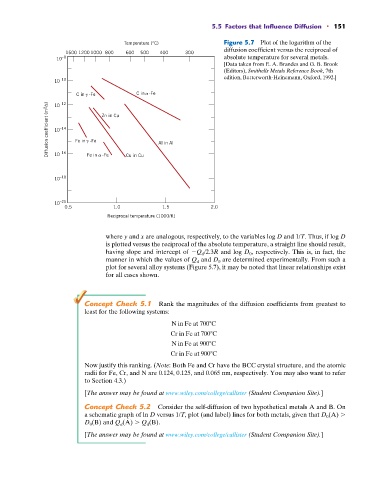
Temperature (°C) Figure 5.7 Plot of the logarithm of the
diffusion coefficient versus the reciprocal of
1500 1200 1000 800 600 500 400 300
10 –8 absolute temperature for several metals.
[Data taken from E. A. Brandes and G. B. Brook
(Editors), Smithells Metals Reference Book, 7th
edition, Butterworth-Heinemann, Oxford, 1992.]
10 –10
C in -Fe C in -Fe
Diffusion coefficient (m 2 /s) 10 –14 Fe in -Fe Zn in Cu Al in Al
–12
10
–16
10
10 –18 Fe in -Fe Cu in Cu
10 –20
0.5 1.0 1.5 2.0
Reciprocal temperature (1000/K)
where y and x are analogous, respectively, to the variables log D and 1/T. Thus, if log D
is plotted versus the reciprocal of the absolute temperature, a straight line should result,
having slope and intercept of Q d /2.3R and log D 0 , respectively. This is, in fact, the
manner in which the values of Q d and D 0 are determined experimentally. From such a
plot for several alloy systems (Figure 5.7), it may be noted that linear relationships exist
for all cases shown.
Concept Check 5.1 Rank the magnitudes of the diffusion coefficients from greatest to
least for the following systems:
N in Fe at 700 C
Cr in Fe at 700 C
N in Fe at 900 C
Cr in Fe at 900 C
Now justify this ranking. (Note: Both Fe and Cr have the BCC crystal structure, and the atomic
radii for Fe, Cr, and N are 0.124, 0.125, and 0.065 nm, respectively. You may also want to refer
to Section 4.3.)
[The answer may be found at www.wiley.com/college/callister (Student Companion Site).]
Concept Check 5.2 Consider the self-diffusion of two hypothetical metals A and B. On
a schematic graph of ln D versus 1/T, plot (and label) lines for both metals, given that D 0 (A)
D 0 (B) and Q d (A) Q d (B).
[The answer may be found at www.wiley.com/college/callister (Student Companion Site).]