
Page 183 - Materials Science and Engineering An Introduction
P. 183
5.6 Diffusion in Semiconducting Materials • 155
also remains constant over time, such that impurity concentration within the silicon is a
function of position and time according to Equation 5.5—that is,
x
C x - C 0
= 1 - erfa b
21Dt
C s - C 0
Predeposition treatments are normally carried out within the temperature range of
900 C and 1000 C and for times typically less than 1 h.
The second treatment, sometimes called drive-in diffusion, is used to transport im-
purity atoms farther into the silicon in order to provide a more suitable concentration
distribution without increasing the overall impurity content. This treatment is carried
out at a higher temperature than the predeposition one (up to about 1200 C) and also
in an oxidizing atmosphere so as to form an oxide layer on the surface. Diffusion rates
through this SiO 2 layer are relatively slow, such that very few impurity atoms diffuse out
of and escape from the silicon. Schematic concentration profiles taken at three different
times for this diffusion situation are shown in Figure 5.9; these profiles may be compared
and contrasted to those in Figure 5.5 for the case in which the surface concentration
of diffusing species is held constant. In addition, Figure 5.10 compares (schematically)
concentration profiles for predeposition and drive-in treatments.
If we assume that the impurity atoms introduced during the predeposition treat-
ment are confined to a very thin layer at the surface of the silicon (which, of course,
is only an approximation), then the solution to Fick’s second law (Equation 5.4b) for
drive-in diffusion takes the form
Q 0 x 2
C(x, t) = expa - b (5.11)
1pDt 4Dt
Here, Q 0 represents the total amount of impurities in the solid that were introduced during
the predeposition treatment (in number of impurity atoms per unit area); all other parame-
ters in this equation have the same meanings as previously. Furthermore, it can be shown that
D p t p
Q 0 = 2C s (5.12)
B p
where C s is the surface concentration for the predeposition step (Figure 5.10), which was
held constant, D p is the diffusion coefficient, and t p is the predeposition treatment time.
Another important diffusion parameter is junction depth, x j . It represents the
depth (i.e., value of x) at which the diffusing impurity concentration is just equal to
C
s
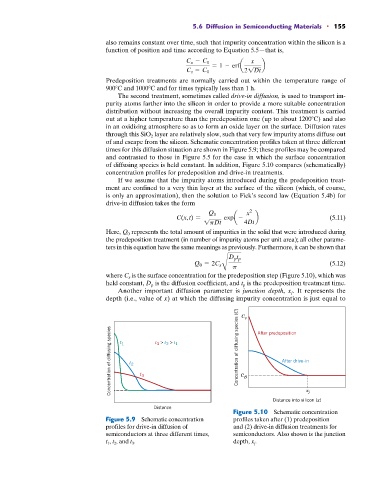
Concentration of diffusing species t 1 t 2 t 3 t > t > t Concentration of diffusing species (C) C B After predeposition
3 2 1
After drive-in
x
j
Distance into silicon (x)
Distance
Figure 5.10 Schematic concentration
Figure 5.9 Schematic concentration profiles taken after (1) predeposition
profiles for drive-in diffusion of and (2) drive-in diffusion treatments for
semiconductors at three different times, semiconductors. Also shown is the junction
t 1 , t 2 , and t 3 . depth, x j .