
Page 196 - Materials Science and Engineering An Introduction
P. 196
C h a p t e r 6 Mechanical Properties of Metals
2000
TS
2000
Stress (MPa) 1000 E Stress (MPa) y
1000
Model H300KU Universal Testing Machine by Tinius Olsen
0
0 0.010
Strain
0
0.000 0.040 0.080
Strain
(b)
(a)
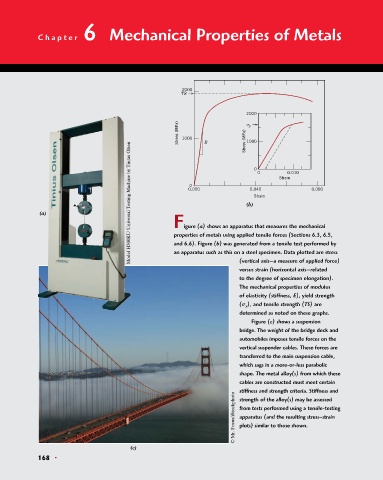
Figure (a) shows an apparatus that measures the mechanical
properties of metals using applied tensile forces (Sections 6.3, 6.5,
and 6.6). Figure (b) was generated from a tensile test performed by
an apparatus such as this on a steel specimen. Data plotted are stress
(vertical axis—a measure of applied force)
versus strain (horizontal axis—related
to the degree of specimen elongation).
The mechanical properties of modulus
of elasticity (stiffness, E), yield strength
(s y ), and tensile strength (TS) are
determined as noted on these graphs.
Figure (c) shows a suspension
bridge. The weight of the bridge deck and
automobiles imposes tensile forces on the
vertical suspender cables. These forces are
transferred to the main suspension cable,
which sags in a more-or-less parabolic
shape. The metal alloy(s) from which these
cables are constructed must meet certain
stiffness and strength criteria. Stiffness and
© Mr. Focus/iStockphoto from tests performed using a tensile-testing
strength of the alloy(s) may be assessed
apparatus (and the resulting stress–strain
plots) similar to those shown.
(c)
168 •