Page 204 - Materials Science and Engineering An Introduction
P. 204

176   •  Chapter 6    /    Mechanical Properties of Metals

            Figure 6.7  Force versus interatomic
            separation for weakly and strongly bonded
            atoms. The magnitude of the modulus of
            elasticity is proportional to the slope of each                   Strongly
            curve at the equilibrium interatomic                              bonded
            separation r 0 .                              dF
                                                          dr  r 0
                                                  Force F  0                                    Separation r


                                                                Weakly
                                                                bonded


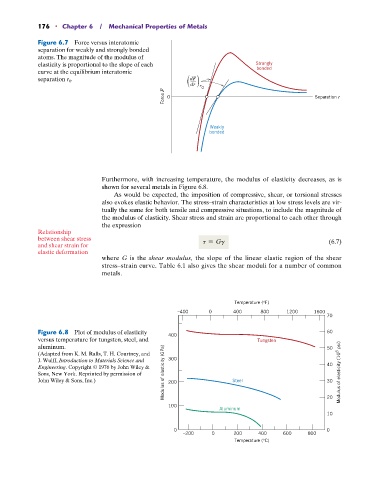
                                Furthermore, with increasing temperature, the modulus of elasticity decreases, as is
                                shown for several metals in Figure 6.8.
                                   As would be expected, the imposition of compressive, shear, or torsional stresses
                                also evokes elastic behavior. The stress–strain characteristics at low stress levels are vir-
                                tually the same for both tensile and compressive situations, to include the magnitude of
                                the modulus of elasticity. Shear stress and strain are proportional to each other through
                                the expression
            Relationship
            between shear stress                                                                    (6.7)
            and shear strain for                              t = Gg
            elastic deformation
                                where  G  is the shear modulus,  the slope of the linear elastic region of the shear
                                stress–strain curve. Table 6.1 also gives the shear moduli for a number of common
                                metals.


                                                                       Temperature (°F)
                                                      –400      0      400     800     1200    1600
                                                                                                   70

            Figure 6.8  Plot of modulus of elasticity   400                                        60
            versus temperature for tungsten, steel, and                       Tungsten
            aluminum.                                                                              50
            (Adapted from K. M. Ralls, T. H. Courtney, and
            J. Wulff, Introduction to Materials Science and   300
            Engineering. Copyright © 1976 by John Wiley &                                          40
            Sons, New York. Reprinted by permission of   Modulus of elasticity (GPa)                   Modulus of elasticity (10 6  psi)
            John Wiley & Sons, Inc.)                200                Steel                       30


                                                    100                                            20
                                                                   Aluminum
                                                                                                   10
                                                     0                                             0
                                                        –200     0     200     400    600    800
                                                                       Temperature (°C)
   199   200   201   202   203   204   205   206   207   208   209