
Page 286 - Materials Science and Engineering An Introduction
P. 286
258 • Chapter 8 / Failure
SEM Micrograph
Grain boundaries Path of crack propagation
(a) (b)
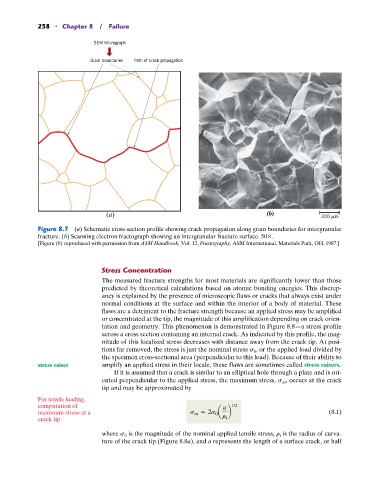
Figure 8.7 (a) Schematic cross-section profile showing crack propagation along grain boundaries for intergranular
fracture. (b) Scanning electron fractograph showing an intergranular fracture surface. 50 .
[Figure (b) reproduced with permission from ASM Handbook, Vol. 12, Fractography, ASM International, Materials Park, OH, 1987.]
Stress Concentration
The measured fracture strengths for most materials are significantly lower than those
predicted by theoretical calculations based on atomic bonding energies. This discrep-
ancy is explained by the presence of microscopic flaws or cracks that always exist under
normal conditions at the surface and within the interior of a body of material. These
flaws are a detriment to the fracture strength because an applied stress may be amplified
or concentrated at the tip, the magnitude of this amplification depending on crack orien-
tation and geometry. This phenomenon is demonstrated in Figure 8.8—a stress profile
across a cross section containing an internal crack. As indicated by this profile, the mag-
nitude of this localized stress decreases with distance away from the crack tip. At posi-
tions far removed, the stress is just the nominal stress s 0 , or the applied load divided by
the specimen cross-sectional area (perpendicular to this load). Because of their ability to
stress raiser amplify an applied stress in their locale, these flaws are sometimes called stress raisers.
If it is assumed that a crack is similar to an elliptical hole through a plate and is ori-
ented perpendicular to the applied stress, the maximum stress, s m , occurs at the crack
tip and may be approximated by
For tensile loading,
computation of a 1/2
maximum stress at a s m = 2s 0 a b (8.1)
crack tip r t
where s 0 is the magnitude of the nominal applied tensile stress, r t is the radius of curva-
ture of the crack tip (Figure 8.8a), and a represents the length of a surface crack, or half