
Page 182 - Mechanical design of microresonators _ modeling and applications
P. 182
0-07-145538-8_CH04_181_08/30/05
Microbridges: Lumped-Parameter Modeling and Design
Microbridges: Lumped-Parameter Modeling and Design 181
3
2.75
2.5
r ω b
2.25
2
1.75
1.5
0.6 0.8 1 1.2 1.4 1.6 1.8 2
c t
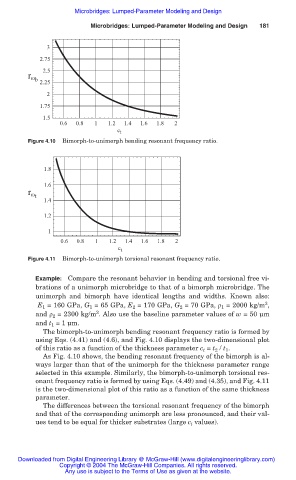
Figure 4.10 Bimorph-to-unimorph bending resonant frequency ratio.
1.8
1.6
r ω t
1.4
1.2
1
0.6 0.8 1 1.2 1.4 1.6 1.8 2
c t
Figure 4.11 Bimorph-to-unimorph torsional resonant frequency ratio.
Example: Compare the resonant behavior in bending and torsional free vi-
brations of a unimorph microbridge to that of a bimorph microbridge. The
unimorph and bimorph have identical lengths and widths. Known also:
3
E 1 = 160 GPa, G 1 = 65 GPa, E 2 = 170 GPa, G 2 = 70 GPa, ȡ 1 = 2000 kg/m ,
3
and ȡ 2 = 2300 kg/m . Also use the baseline parameter values of w = 50 Ím
and t 1 = 1 Ím.
The bimorph-to-unimorph bending resonant frequency ratio is formed by
using Eqs. (4.41) and (4.6), and Fig. 4.10 displays the two-dimensional plot
of this ratio as a function of the thickness parameter c t = t 2 / t 1 .
As Fig. 4.10 shows, the bending resonant frequency of the bimorph is al-
ways larger than that of the unimorph for the thickness parameter range
selected in this example. Similarly, the bimorph-to-unimorph torsional res-
onant frequency ratio is formed by using Eqs. (4.49) and (4.35), and Fig. 4.11
is the two-dimensional plot of this ratio as a function of the same thickness
parameter.
The differences between the torsional resonant frequency of the bimorph
and that of the corresponding unimorph are less pronounced, and their val-
ues tend to be equal for thicker substrates (large c t values).
Downloaded from Digital Engineering Library @ McGraw-Hill (www.digitalengineeringlibrary.com)
Copyright © 2004 The McGraw-Hill Companies. All rights reserved.
Any use is subject to the Terms of Use as given at the website.