Page 245 - Mechanical design of microresonators _ modeling and applications
P. 245

0-07-145538-8_CH05_244_08/30/05


                                                 Resonant Micromechanical Systems

                              244   Chapter Five


                                       2.5                                        10
                              ω I , be  / ω  III , be
                                        1.5

                                          1
                                                                                c w

                                                    c l
                                                                      5
                                                                    5
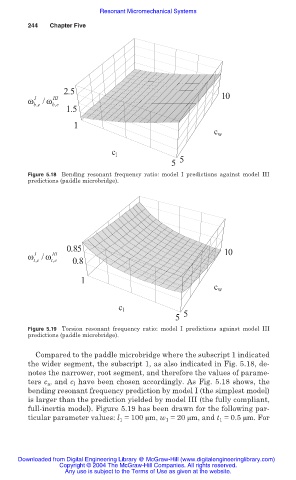
                              Figure 5.18 Bending resonant  frequency ratio: model I predictions against  model  III
                              predictions (paddle microbridge).


                                        0.85
                              ω I  / ω  III                                       10
                                , te  , te  0.8

                                            1
                                                                                c w

                                                      c l              5
                                                                     5
                              Figure 5.19 Torsion  resonant  frequency ratio: model I predictions against model III
                              predictions (paddle microbridge).


                                Compared to the paddle microbridge where the subscript 1 indicated
                              the wider segment, the subscript 1, as also indicated in Fig. 5.18, de-
                              notes the narrower, root segment, and therefore the values of parame-
                              ters c  and c  have been chosen accordingly. As Fig. 5.18 shows, the
                                   w
                                          l
                              bending resonant frequency prediction by model I (the simplest model)
                              is larger than the prediction yielded by model III (the fully compliant,
                              full-inertia model). Figure 5.19 has been drawn for the following par-
                              ticular parameter values: l 1  = 100 ȝm, w 1  = 20 ȝm, and t 1  = 0.5 ȝm. For


                           Downloaded from Digital Engineering Library @ McGraw-Hill (www.digitalengineeringlibrary.com)
                                      Copyright © 2004 The McGraw-Hill Companies. All rights reserved.
                                        Any use is subject to the Terms of Use as given at the website.
   240   241   242   243   244   245   246   247   248   249   250