
Page 242 - Mechanical design of microresonators _ modeling and applications
P. 242
0-07-145538-8_CH05_241_08/30/05
Resonant Micromechanical Systems
Resonant Micromechanical Systems 241
8
10
error [%]
0
1
c w
c l
1
10
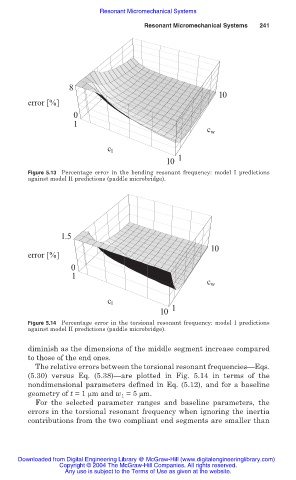
Figure 5.13 Percentage error in the bending resonant frequency: model I predictions
against model II predictions (paddle microbridge).
1.5
10
error [%]
0
1
c w
c l
1
10
Figure 5.14 Percentage error in the torsional resonant frequency: model I predictions
against model II predictions (paddle microbridge).
diminish as the dimensions of the middle segment increase compared
to those of the end ones.
The relative errors between the torsional resonant frequencies—Eqs.
(5.30) versus Eq. (5.38)—are plotted in Fig. 5.14 in terms of the
nondimensional parameters defined in Eq. (5.12), and for a baseline
geometry of t = 1 ȝm and w = 5 ȝm.
1
For the selected parameter ranges and baseline parameters, the
errors in the torsional resonant frequency when ignoring the inertia
contributions from the two compliant end segments are smaller than
Downloaded from Digital Engineering Library @ McGraw-Hill (www.digitalengineeringlibrary.com)
Copyright © 2004 The McGraw-Hill Companies. All rights reserved.
Any use is subject to the Terms of Use as given at the website.