
Page 243 - Mechanical design of microresonators _ modeling and applications
P. 243
0-07-145538-8_CH05_242_08/30/05
Resonant Micromechanical Systems
242 Chapter Five
25
I
I
ω te /ω b e 0.1
,
,
10
0.00001
c w ´
c t 0.05
0.08
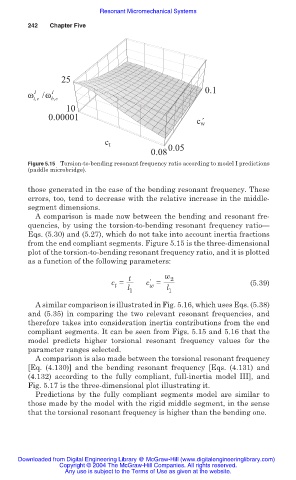
Figure 5.15 Torsion-to-bending resonant frequency ratio according to model I predictions
(paddle microbridge).
those generated in the case of the bending resonant frequency. These
errors, too, tend to decrease with the relative increase in the middle-
segment dimensions.
A comparison is made now between the bending and resonant fre-
quencies, by using the torsion-to-bending resonant frequency ratio—
Eqs. (5.30) and (5.27), which do not take into account inertia fractions
from the end compliant segments. Figure 5.15 is the three-dimensional
plot of the torsion-to-bending resonant frequency ratio, and it is plotted
as a function of the following parameters:
t w 2
ƍ
c = c = (5.39)
t
w
l
1 l 1
A similar comparison is illustrated in Fig. 5.16, which uses Eqs. (5.38)
and (5.35) in comparing the two relevant resonant frequencies, and
therefore takes into consideration inertia contributions from the end
compliant segments. It can be seen from Figs. 5.15 and 5.16 that the
model predicts higher torsional resonant frequency values for the
parameter ranges selected.
A comparison is also made between the torsional resonant frequency
[Eq. (4.130)] and the bending resonant frequency [Eqs. (4.131) and
(4.132) according to the fully compliant, full-inertia model III], and
Fig. 5.17 is the three-dimensional plot illustrating it.
Predictions by the fully compliant segments model are similar to
those made by the model with the rigid middle segment, in the sense
that the torsional resonant frequency is higher than the bending one.
Downloaded from Digital Engineering Library @ McGraw-Hill (www.digitalengineeringlibrary.com)
Copyright © 2004 The McGraw-Hill Companies. All rights reserved.
Any use is subject to the Terms of Use as given at the website.