
Page 244 - Mechanical design of microresonators _ modeling and applications
P. 244
0-07-145538-8_CH05_243_08/30/05
Resonant Micromechanical Systems
Resonant Micromechanical Systems 243
6 10
ω II , te /ω II , b e 4 2
0
0.5
c w
c l
2
5
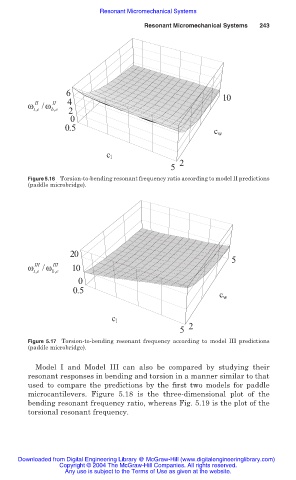
Figure 5.16 Torsion-to-bending resonant frequency ratio according to model II predictions
(paddle microbridge).
20
5
ω III / ω III 10
, te
, b e
0
0.5
c w
c l
2
5
Figure 5.17 Torsion-to-bending resonant frequency according to model III predictions
(paddle microbridge).
Model I and Model III can also be compared by studying their
resonant responses in bending and torsion in a manner similar to that
used to compare the predictions by the first two models for paddle
microcantilevers. Figure 5.18 is the three-dimensional plot of the
bending resonant frequency ratio, whereas Fig. 5.19 is the plot of the
torsional resonant frequency.
Downloaded from Digital Engineering Library @ McGraw-Hill (www.digitalengineeringlibrary.com)
Copyright © 2004 The McGraw-Hill Companies. All rights reserved.
Any use is subject to the Terms of Use as given at the website.