
Page 237 - Mechanical design of microresonators _ modeling and applications
P. 237
0-07-145538-8_CH05_236_08/30/05
Resonant Micromechanical Systems
236 Chapter Five
8
0.8
I- II
rω b
2
0.1
0.
1
c t
cl
0.1
1 1
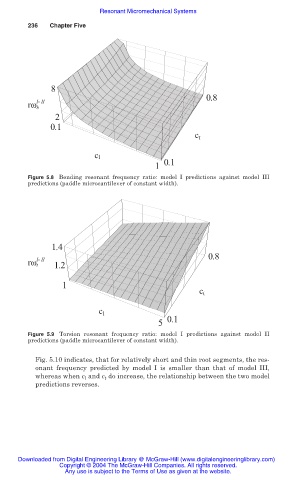
Figure 5.8 Bending resonant frequency ratio: model I predictions against model III
predictions (paddle microcantilever of constant width).
1.4
0.8
I- II
rω t 1.2
1 1
c t
c l
5 5 0.1
Figure 5.9 Torsion resonant frequency ratio: model I predictions against model II
predictions (paddle microcantilever of constant width).
Fig. 5.10 indicates, that for relatively short and thin root segments, the res-
onant frequency predicted by model I is smaller than that of model III,
whereas when c l and c t do increase, the relationship between the two model
predictions reverses.
Downloaded from Digital Engineering Library @ McGraw-Hill (www.digitalengineeringlibrary.com)
Copyright © 2004 The McGraw-Hill Companies. All rights reserved.
Any use is subject to the Terms of Use as given at the website.