
Page 233 - Mechanical design of microresonators _ modeling and applications
P. 233
0-07-145538-8_CH05_232_08/30/05
Resonant Micromechanical Systems
232 Chapter Five
1.0015
0.1
I- II
rω t
1
1 1
c w
c l 0.01
5 5
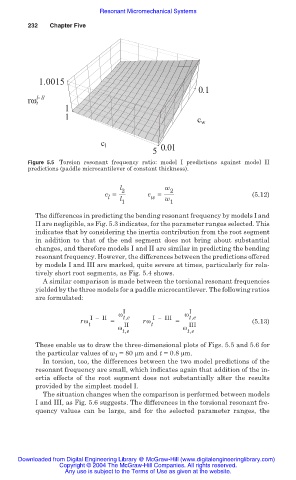
Figure 5.5 Torsion resonant frequency ratio: model I predictions against model II
predictions (paddle microcantilever of constant thickness).
l 2 w 2
c = c = (5.12)
l l w w
1 1
The differences in predicting the bending resonant frequency by models I and
II are negligible, as Fig. 5.3 indicates, for the parameter ranges selected. This
indicates that by considering the inertia contribution from the root segment
in addition to that of the end segment does not bring about substantial
changes, and therefore models I and II are similar in predicting the bending
resonant frequency. However, the differences between the predictions offered
by models I and III are marked, quite severe at times, particularly for rela-
tively short root segments, as Fig. 5.4 shows.
A similar comparison is made between the torsional resonant frequencies
yielded by the three models for a paddle microcantilever. The following ratios
are formulated:
Ȧ I Ȧ I
I – II t,e I – III t,e
rȦ = rȦ = (5.13)
t II t III
Ȧ Ȧ
t,e t,e
These enable us to draw the three-dimensional plots of Figs. 5.5 and 5.6 for
the particular values of w 1 = 80 ȝm and t = 0.8 ȝm.
In torsion, too, the differences between the two model predictions of the
resonant frequency are small, which indicates again that addition of the in-
ertia effects of the root segment does not substantially alter the results
provided by the simplest model I.
The situation changes when the comparison is performed between models
I and III, as Fig. 5.6 suggests. The differences in the torsional resonant fre-
quency values can be large, and for the selected parameter ranges, the
Downloaded from Digital Engineering Library @ McGraw-Hill (www.digitalengineeringlibrary.com)
Copyright © 2004 The McGraw-Hill Companies. All rights reserved.
Any use is subject to the Terms of Use as given at the website.