
Page 63 - Mechanical design of microresonators _ modeling and applications
P. 63
0-07-145538-8_CH02_62_08/30/05
Basic Members: Lumped- and Distributed-Parameter Modeling and Design
62 Chapter Two
d
Figure 2.14 Constant circular cross-section microbar.
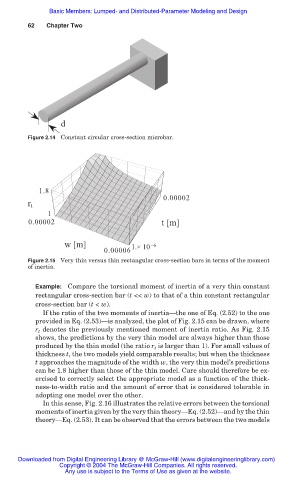
1.8
0.00002
r t
1
0.00002 t [m]
w [m] 1.× 10 -6
0.00006
Figure 2.15 Very thin versus thin rectangular cross-section bars in terms of the moment
of inertia.
Example: Compare the torsional moment of inertia of a very thin constant
rectangular cross-section bar (t << w) to that of a thin constant rectangular
cross-section bar (t < w).
If the ratio of the two moments of inertia–the one of Eq. (2.52) to the one
provided in Eq. (2.53)–is analyzed, the plot of Fig. 2.15 can be drawn, where
r t denotes the previously mentioned moment of inertia ratio. As Fig. 2.15
shows, the predictions by the very thin model are always higher than those
produced by the thin model (the ratio r t is larger than 1). For small values of
thickness t, the two models yield comparable results; but when the thickness
t approaches the magnitude of the width w, the very thin model’s predictions
can be 1.8 higher than those of the thin model. Care should therefore be ex-
ercised to correctly select the appropriate model as a function of the thick-
ness-to-width ratio and the amount of error that is considered tolerable in
adopting one model over the other.
In this sense, Fig. 2.16 illustrates the relative errors between the torsional
moments of inertia given by the very thin theory–Eq. (2.52)–and by the thin
theory–Eq. (2.53). It can be observed that the errors between the two models
Downloaded from Digital Engineering Library @ McGraw-Hill (www.digitalengineeringlibrary.com)
Copyright © 2004 The McGraw-Hill Companies. All rights reserved.
Any use is subject to the Terms of Use as given at the website.