
Page 425 - Mechanical Engineers' Handbook (Volume 4)
P. 425
414 Cooling Electronic Equipment
The range of validity 49 for this correlation, developed from extensive gas jet data, as well
as some data for water and other, higher Prandtl number liquids, and including some high
3
5
Schmidt number mass-transfer data, is 2 10 Re 10 , 0.6 Pr(Sc) 7(900), 0.004
D
ƒ 0.04 and 2 H/D 12. This correlation has a predictive accuracy of 10–20% over
the stated parametric range. The average Nu was also found to be nearly unaffected by the
angle of inclination of the jet. It is to be noted that for jets produced by sharp-edged orifices,
jet contraction immediately after the orifice exit must be taken into consideration in calcu-
lating the average velocity, jet diameter, and nozzle area ratio, ƒ. In applying this correlation
to the cooling of electronic components, constituting discrete heat sources on a large surface,
it is necessary to alter the definition of the jet area ratio, ƒ. Recognizing that, in this appli-
cation, the impingement area is usually equal to the component area, f can be expressed as
nA jet 0.785Dn
2
ƒ (125)
A A
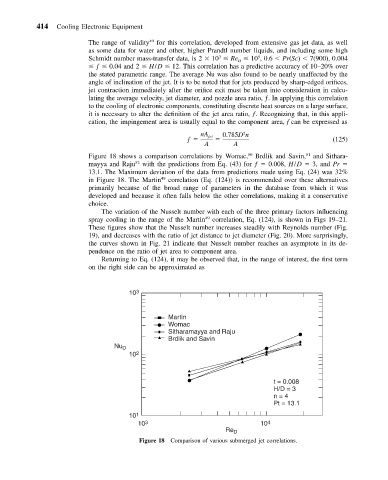
Figure 18 shows a comparison correlations by Womac, 50 Brdlik and Savin, 51 and Sithara-
mayya and Raju 52 with the predictions from Eq. (43) for ƒ 0.008, H/D 3, and Pr
13.1. The Maximum deviation of the data from predictions made using Eq. (24) was 32%
in Figure 18. The Martin 49 correlation (Eq. (124)) is recommended over these alternatives
primarily because of the broad range of parameters in the database from which it was
developed and because it often falls below the other correlations, making it a conservative
choice.
The variation of the Nusselt number with each of the three primary factors influencing
spray cooling in the range of the Martin 49 correlation, Eq. (124), is shown in Figs 19–21.
These figures show that the Nusselt number increases steadily with Reynolds number (Fig.
19), and decreases with the ratio of jet distance to jet diameter (Fig. 20). More surprisingly,
the curves shown in Fig. 21 indicate that Nusselt number reaches an asymptote in its de-
pendence on the ratio of jet area to component area.
Returning to Eq. (124), it may be observed that, in the range of interest, the first term
on the right side can be approximated as
10 3
Martin
Womac
Sitharamayya and Raju
Brdlik and Savin
Nu D
10 2
t = 0.008
H/D = 3
n = 4
Pt = 13.1
10 1
10 3 10 4
Re D
Figure 18 Comparison of various submerged jet correlations.