
Page 352 - Mechanics Analysis Composite Materials
P. 352
Chapter 7. Environmental, special loading, and manufacturing efecfs 337
1
0.8
0.6
0.4
0.2
0"""" log N
0 1 2 3 4 5 6 7
Fig. 7.25. Typical fatigue diagrams for carbon-epoxy composite (solid lines) and aluminum alloy
(broken lines) specimens without (1) and with (2) stress concentration (fatigue strength is normalized to
sLalk strength of specimens without stress concentration).
belong to brittle materials is reduced by stress concentration that practically does
not affect the slope of the fatigue curve. On average, residual strength of carbon
composites after lo6 loading cycles makes 7&80% of material static strength in
comparison with 3WO% for aluminum alloys. Qualitatively, this comparative
evaluation is true for all fibrous composites that are widely used in structural
elements subjected to intensive vibrations such as helicopter rotor blades, airplane
propellers, drive shafts, automobile leaf-springs, etc.
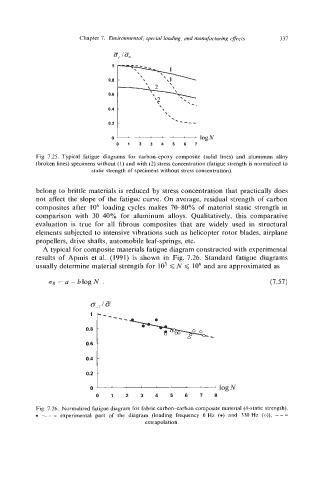
A typical for composite materials fatigue diagram constructed with experimental
results of Apinis et al. (1991) is shown in Fig. 7.26. Standard fatigue diagrams
usually determine material strength for IO3 d N G lo6 and are approximated as
(TR = a - hlog N . (7.57)
t
I logN
0 1 2 3 4 5 6 7 8
. o experimental part of the diagram (loading frequency 6 Hz (a) and 330 Hz (0)). ---
Fig. 7.26. Normalized fatigue diagram for fabric carbon-carbon composite material (@-staticstrength).
extrapolation.