
Page 335 - Mechanics of Microelectromechanical Systems
P. 335
322 Chapter 5
and the slenderness ratio, which is:
the critical stress of Eq. (5.159) becomes:
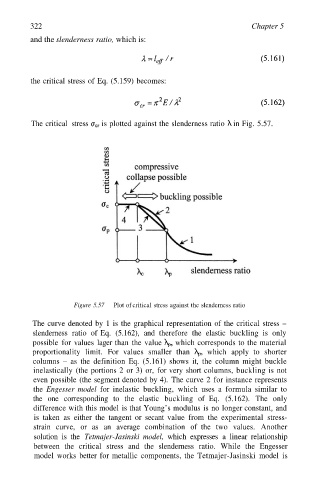
The critical stress is plotted against the slenderness ratio in Fig. 5.57.
Figure 5.57 Plot of critical stress against the slenderness ratio
The curve denoted by 1 is the graphical representation of the critical stress –
slenderness ratio of Eq. (5.162), and therefore the elastic buckling is only
possible for values lager than the value which corresponds to the material
proportionality limit. For values smaller than which apply to shorter
columns – as the definition Eq. (5.161) shows it, the column might buckle
inelastically (the portions 2 or 3) or, for very short columns, buckling is not
even possible (the segment denoted by 4). The curve 2 for instance represents
the Engesser model for inelastic buckling, which uses a formula similar to
the one corresponding to the elastic buckling of Eq. (5.162). The only
difference with this model is that Young’s modulus is no longer constant, and
is taken as either the tangent or secant value from the experimental stress-
strain curve, or as an average combination of the two values. Another
solution is the Tetmajer-Jasinski model, which expresses a linear relationship
between the critical stress and the slenderness ratio. While the Engesser
model works better for metallic components, the Tetmajer-Jasinski model is