
Page 353 - Mechatronics for Safety, Security and Dependability in a New Era
P. 353
Ch68-I044963.fm Page 337 Tuesday, August 1, 2006 8:30 PM
1, 2006
Tuesday, August
Page 337
Ch68-I044963.fm
8:30 PM
337
337
r = T r-T d, (3)
where T d is the compensation time for the system delay and the value is determined by trial and error.
(In the experiment, T d =60ms.)
EXPERIMENTAL INVESTIGATION OF THE DYNAMIC PERFORMANCE OF THE
SYSTEM
As the experimental condition, the supply pressure p, =10MPa, the road amplitude x r =±5mm, and
3
the control gain C Aa = 4xlO %/(m/s). In order to evaluate the robustness of the controller, time error
AT d is added as shown in Figure 7. Point A is the present position on the road and point B is the
preview position forward of point A. The error time AT d (=+30%, +50%, +100% of T d) is added to
the compensation time T d .
0% error
" °
* -6 +30% error
„ 6
E
t °
* -6
^ 6
E
" 0
0 + 100°/J error
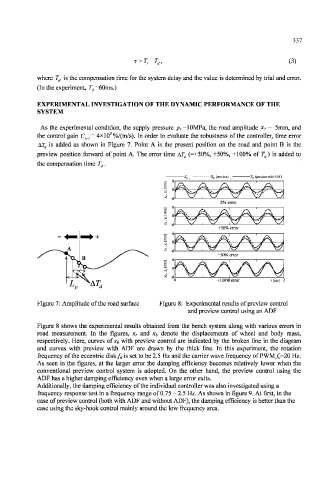
Figure 7: Amplitude of the road surface Figure 8: Experimental results of preview control
and preview control using an ADF
Figure 8 shows the experimental results obtained from the bench system along with various errors in
road measurement. In the figures, x r and xt denote the displacements of wheel and body mass,
respectively. Here, curves of xj with preview control are indicated by the broken line in the diagram
and curves with preview with ADF are drawn by the thick line. In this experiment, the rotation
frequency of the eccentric disk/j is set to be 2.5 Hz and the carrier wave frequency of PWM/^.=20 Hz.
As seen in the figures, at the larger error the damping efficiency becomes relatively lower when the
conventional preview control system is adopted. On the other hand, the preview control using the
ADF has a higher damping efficiency even when a large error exits.
Additionally, the damping efficiency of the individual controller was also investigated using a
frequency response test in a frequency range of 0.75 - 2.5 Hz. As shown in figure 9. At first, in the
case of preview control (both with ADF and without ADF), the damping efficiency is better than the
case using the sky-hook control mainly around the low frequency area.