
Page 220 - Membranes for Industrial Wastewater Recovery and Re-Use
P. 220
System design aids 1 89
constraints (Wang and Smith, 1994a) and later extended to fixed flow rate
(Wang and Smith, 1995) since this situation is most common in process
industries. However, the original methodology can be extended to processes with
flow rate constraints.
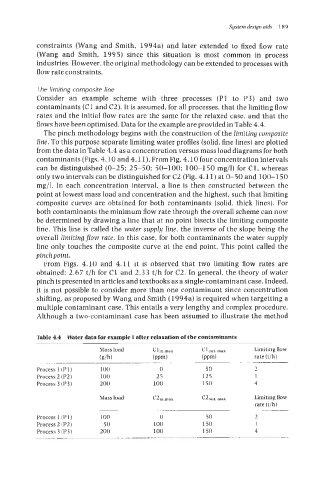
The limiting composite he
Consider an example scheme with three processes (P1 to P3) and two
contaminants (C1 and C2). It is assumed, for all processes, that the limiting flow
rates and the initial flow rates are thc same for the relaxed case, and that the
flows have been optimised. Data for the example are provided in Table 4.4.
The pinch methodology begins with the construction of the limiting composite
line. To this purpose separate limiting water profiles (solid, fine lines) are plotted
from the data in Table 4.4 as a concentration versus mass load diagrams for both
contaminants (Figs. 4.10 and 4.1 1). From Fig. 4.10 four concentration intervals
can be distinguished (0-25; 25-50; 50-100; 100-150 mg/l) for C1, whereas
only two intervals can be distinguished for C2 (Pig. 4.1 1) at 0-50 and 100-1 50
mg/l. In each concentration interval, a line is then constructed between the
point at lowest mass load and concentration and the highest, such that limiting
composite curves are obtained for both contaminants (solid, thick lines). For
both contaminants the minimum flow rate through the overall scheme can now
be determined by drawing a line that at no point bisects the limiting composite
line. This line is called the water supply line, the inverse of the slope being the
overall lirnitingflow rate. In this case, for both contaminants the water supply
line only touches the composite curve at the end point. This point called the
pinch point.
From Figs. 4.10 and 4.11 it is observed that two limiting flow rates are
obtained: 2.67 t/h for C1 and 2.33 t/h for C2. In general, the theory of water
pinch is presented in articles and textbooks as a single-contaminant case. Indeed,
it is not possible to consider more than one contaminant since concentration
shifting, as proposed by Wang and Smith (1994a) is required when targetting a
multiple contaminant case. This entails a very lengthy and complex procedure.
Although a two-contaminant case has been assumed to illustrate the method
Table 4.4 Water data for example 1 after relaxation of the contaminants
Mass load C1 inmux C10"t. max Limiting flow
(dh) (PPm) (PPm) rate (t/h)
Process 1 (Pl) 100 0 50 7
Process 2 (P2) 100 25 125 1
Process 3 (P3) 200 100 150 4
Mass load C2in.rnax C20"t. *ax Limiting flow
rate (t/h)
Process 1 (Pl) 100 0 50 7
1
Process 2 (P2) 50 100 150 1
Process 3 (P3) 200 100 150 4
--