
Page 224 - Membranes for Industrial Wastewater Recovery and Re-Use
P. 224
System design aids 193
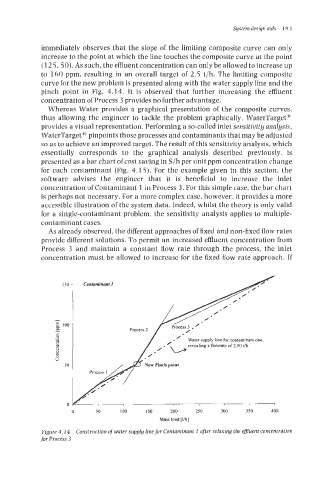
immediately observes that the slope of the limiting composite curve can only
increase to the point at which the line touches the composite curve at the point
(125, 50). As such, the effluent concentration can only be allowed to increase up
to 160 ppm, resulting in an overall target of 2.5 t/h. The limiting composite
curve for the new problem is presented along with the water supply line and the
pinch point in Fig. 4.14. It is observed that further increasing the effluent
concentration of Process 3 provides no further advantage.
Whereas Water provides a graphical presentation of the composite curves,
thus allowing the engineer to tackle the problem graphically, WaterTarget
provides a visual representation. Performing a so-called inlet sensitivity analysis,
WaterTargetS pinpoints those processes and contaminants that may be adjusted
so as to achieve an improved target. The result of this sensitivity analysis, which
essentially corresponds to the graphical analysis described previously, is
presented as a bar chart of cost saving in $/h per unit ppm concentration change
for each contaminant (Fig. 4.15). For the example given in this section, the
software advises the engineer that it is beneficial to increase the inlet
concentration of Contaminant 1 in Process 3. For this simple case, the bar chart
is perhaps not necessary. For a more complex case, however, it provides a more
accessible illustration of the system data. Indeed, whilst the theory is only valid
for a single-contaminant problem, the sensitivity analysis applies to multiple-
contaminant cases.
As already observed, the different approaches of fixed and non-fixed flow rates
provide different solutions. To permit an increased effluent concentration from
Process 3 and maintain a constant flow rate through the process, the inlet
concentration must be allowed to increase for the fixed flow rate approach. If
0 50 IO0 150 200 250 300 350 400
Mass load [t/h]
Figure 4.14 Construction of water supply line for Contaminant 1 after relaxing the effluent concentration
for Process 3