
Page 223 - Membranes for Industrial Wastewater Recovery and Re-Use
P. 223
192 Membranes for lndustrial Wastewater Recovery and Re-use
2tnl
Process 1
0.33 t/h
2.67 tib
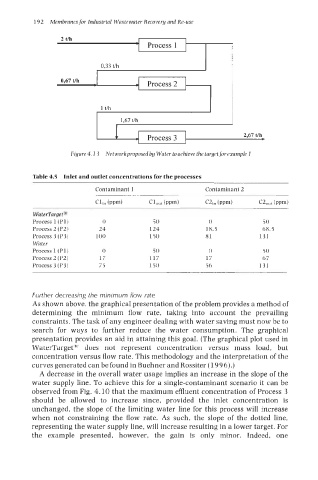
Figure 4. I3 Networkproposed by Water to achieve the targetfor example 1
Table 4.5 Inlet and outlet concentrations for the processes
WaterTargetm
Process 1 (Pl) 0 50 0 50
Process 2 (P2) 24 124 18.5 68.5
Process 3 (P3) 100 150 81 131
Water
Process 1 (Pl) .- ..- .- 50
0
0
..
50
<-
e I.._\
rrocess L (rLj I/ 11/ I/ b/
Process 3 (P3) 75 150 56 131
Further decreasing the minimum flow rate
As shown above, the graphical presentation of the problem provides a method of
determining the minimum flow rate, taking into account the prevailing
constraints. The task of any engineer dealing with water saving must now be to
search for ways to further reduce the water consumption. The graphical
presentation provides an aid in attaining this goal. (The graphical plot used in
WaterTargetO does not represent concentration versus mass load, but
concentration versus flow rate. This methodology and the interpretation of the
curves generated can be found in Buehner and Rossiter (1996).)
A decrease in the overall water usage implies an increase in the slope of the
water supply line. To achieve this for a single-contaminant scenario it can be
observed from Fig. 4.10 that the maximum effluent concentration of Process 3
should be allowed to increase since, provided the inlet concentration is
unchanged, the slope of the limiting water line for this process will increase
when not constraining the flow rate. As such, the slope of the dotted line,
representing the water supply line, will increase resulting in a lower target. For
the example presented, however, the gain is only minor. Indeed, one