
Page 225 - Membranes for Industrial Wastewater Recovery and Re-Use
P. 225
194 Membranesfor Industrial Wastewater Recovery and Re-use
C~IPP~W
CI mmw
c
m
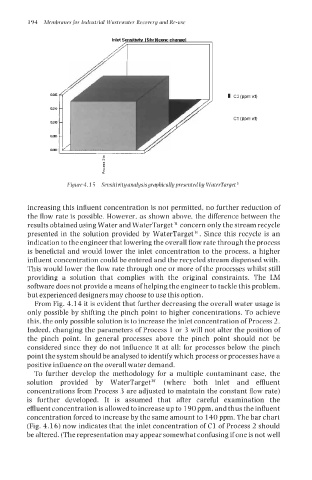
Fiqiire 4.1 5 Sensitivitg analysis graphically presented by WaterTarget
increasing this influent concentration is not permitted, no further reduction of
the flow rate is possible. However, as shown above, the difference between the
results obtained using Water and WaterTarget*” concern only the stream recycle
presented in the solution provided by WaterTargetR’. Since this recycle is an
indication to the engineer that lowering the overall flow rate through the process
is beneficial and would lower the inlet concentration to the process, a higher
influent concentration could be entered and the recycled stream dispensed with.
This would lower the flow rate through one or more of the processes whilst still
providing a solution that complies with the original constraints. The LM
software does not provide a means of helping the engineer to tackle this problem,
but experienced designers may choose to use this option.
From Fig. 4.14 it is evident that further decreasing the overall water usage is
only possible by shifting the pinch point to higher concentrations. To achieve
this, the only possible solution is to increase the inlet concentration of Process 2.
Indeed, changing the parameters of Process 1 or 3 will not alter the position of
the pinch point. In general processes above the pinch point should not be
considered since they do not influence it at all; for processes below the pinch
point the system should be analysed to identify which process or processes have a
positive influence on the overall water demand.
To further develop the methodology for a multiple contaminant case, the
solution provided by WaterTargeP (where both inlet and effluent
concentrations from Process 3 are adjusted to maintain the constant flow rate)
is further developed. It is assumed that after careful examination the
effluent concentration is allowed to increase up to 190 ppm, and thus the influent
concentration forced to increase by the same amount to 140 ppm. The bar chart
(Fig. 4.16) now indicates that the inlet concentration of C1 of Process 2 should
be altered. (The representation may appear somewhat confusing if one is not well