
Page 226 - Membranes for Industrial Wastewater Recovery and Re-Use
P. 226
Sgsteni design aids 19 5
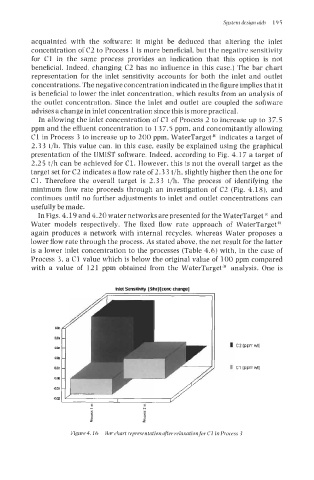
acquainted with the software: it might be deduced that altering the inlet
concentration of C2 to Process 1 is more beneficial, but the negative sensitivity
for C1 in the same process provides an indication that this option is not
beneficial. Indeed, changing C2 has no influence in this case.) The bar chart
representation for the inlet sensitivity accounts for both the inlet and outlet
concentrations. The negative concentration indicated in the figure implies that it
is beneficial to lower the inlet concentration, which results from an analysis of
the outlet concentration. Since the inlet and outlet are coupled the software
advises a change in inlet concentration since this is more practical.
In allowing the inlet concentration of C1 of Process 2 to increase up to 37.5
ppm and the effluent concentration to 13 7.5 ppm, and concomitantly allowing
C1 in Process 3 to increase up to 200 ppm, WaterTargeP indicates a target of
2.33 t/h. This value can, in this case, easily be explained using the graphical
presentation of the UMIST software. Indeed, according to Fig. 4.1 7 a target of
2.25 t/h can be achieved for C1. However, this is not the overall target as the
target set for C2 indicates a flow rate of 2.33 t/h, slightly higher then the one for
C1. Therefore the overall target is 2.33 t/h. The process of identifying the
minimum flow rate proceeds through an investigation of C2 (Fig. 4.18), and
continues until no further adjustments to inlet and outlet concentrations can
usefully be made.
In Figs. 4.19 and 4.20 water networks are presented for the WaterTargetR and
Water models respectively. The fixed flow rate approach of WaterTargetm
again produces a network with internal recycles, whereas Water proposes a
lower flow rate through the process. As stated above, the net result for the latter
is a lower inlet concentration to the processes (Table 4.6) with, in the case of
Process 3, a C1 value which is below the original value of 100 ppm compared
with a value of 121 ppm obtained from the WaterTarget@ analysis. One is
hlet Semitii [$hr]flconc change]
OB
Iw
om I c2(ppmw
om
om li CI {ppmwt)
om
401
-om
- N
1
P
p p
Figure 4.16 Bar chart representation after relaxation for Cl in Process 3